









Global Business Services (GBS) organizations have traditionally measured success through cost savings, transaction volumes, service-level agreements (SLAs), and operational efficiency. While these metrics remain important, they do not tell the complete story of how GBS contributes to enterprise performance. As organizations move toward more integrated, technology-driven operating models, measuring GBS performance requires a broader business perspective.
A well-designed GBS KPI framework connects operational performance with measurable business outcomes. It helps leaders understand whether shared services are reducing costs, improving service quality, strengthening compliance, accelerating business processes, and creating value across functions.
The challenge is not collecting more data. It is identifying the right metrics, understanding their business implications, and using them to guide decisions. This article explores the essential GBS performance indicators, how to organize them into a practical measurement framework, and how organizations can move beyond traditional efficiency metrics to demonstrate strategic value.
Why Traditional GBS Metrics Are No Longer Enough
Historically, GBS performance measurement focused on productivity and cost optimization. Metrics such as cost per transaction, average handling time, SLA compliance, and headcount reduction helped organizations evaluate whether centralized operations were delivering expected efficiencies.
However, these indicators have limitations.
For example, a shared services center might process invoices faster while still experiencing high exception rates, duplicate payments, or supplier complaints. Similarly, an HR service desk might achieve excellent ticket closure rates without improving employee satisfaction or resolving recurring issues.
This approach creates a disconnect between operational performance and business value.
Modern GBS organizations need to evaluate performance across several dimensions:
- Financial performance: How effectively does GBS control operating costs and contribute to financial outcomes?
- Operational excellence: Are processes becoming faster, more accurate, and more consistent?
- Service experience: Are employees, customers, and suppliers receiving reliable and responsive support?
- Risk and compliance: Are controls effective, and are operational risks identified early?
- Business value: Does GBS improve decision-making, scalability, and enterprise agility?
- Digital transformation: Are automation and AI investments producing measurable improvements?
The purpose of a modern GBS KPI framework is to bring these dimensions together instead of treating them as disconnected reporting categories.
The Six KPI Categories Every GBS Organization Should Track
A practical measurement model should cover the complete operating performance of GBS. The following six categories provide a structured approach.
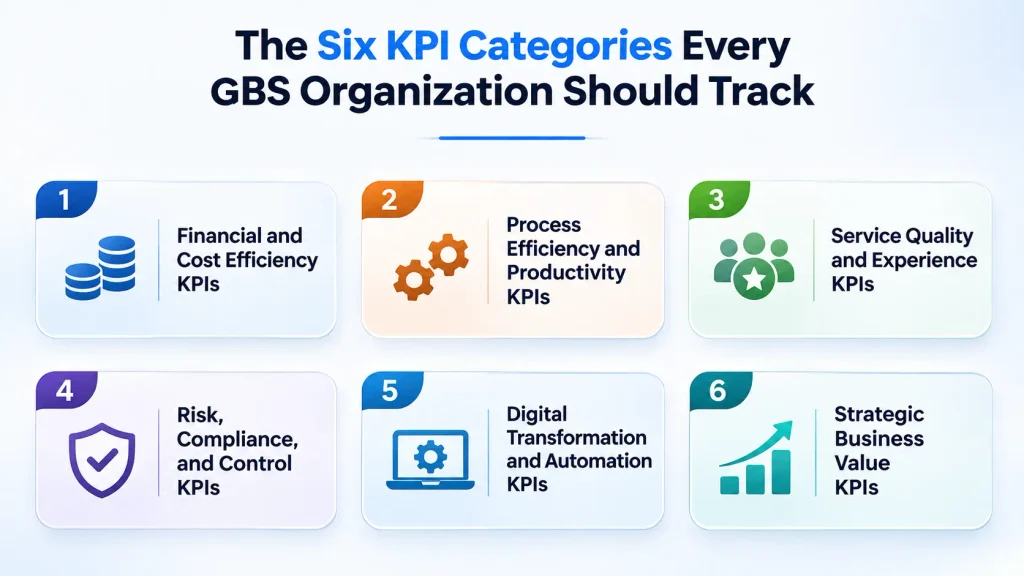
1. Financial and Cost Efficiency KPIs
Financial metrics help determine whether GBS delivers the expected economic benefits of centralization and process optimization.
Important KPIs include:
Cost per transaction: Measures the average cost of completing a specific transaction, such as processing an invoice, handling an employee query, or creating a purchase order.
Formula: Total process operating cost ÷ Number of completed transactions.
Cost savings achieved: Tracks actual savings generated through process improvements, automation, vendor consolidation, and resource optimization against an agreed baseline.
Cost-to-serve: Measures the total cost of delivering a particular service to a business unit, customer group, or geography.
Return on investment (ROI): Evaluates the financial return generated by GBS investments in technology, automation, infrastructure, and transformation initiatives.
These metrics should be evaluated alongside service quality. Reducing cost per transaction is not a meaningful improvement if error rates, rework, or customer complaints increase.
2. Process Efficiency and Productivity KPIs
Operational efficiency measures how effectively GBS processes work from initiation to completion.
Key indicators include:
End-to-end cycle time: Measures the total time required to complete a business process, from the initial request or transaction to final resolution.
First-time-right rate: Tracks the percentage of transactions completed correctly without rework, correction, or resubmission.
Formula: Transactions completed correctly on the first attempt ÷ Total transactions × 100.
Process exception rate: Measures the percentage of transactions that require manual intervention because of missing information, errors, policy deviations, or system issues.
Throughput: Measures the number of transactions or cases completed within a defined period.
Backlog volume and ageing: Tracks pending work and how long unresolved transactions or requests remain in the queue.
Together, these KPIs reveal whether GBS is genuinely improving process performance or simply processing more work with the same underlying inefficiencies.
3. Service Quality and Experience KPIs
GBS exists to support internal and external stakeholders. Therefore, service quality must be measured from the perspective of the people receiving those services.
Relevant indicators include:
SLA compliance rate: Measures the percentage of services delivered within agreed service-level timelines.
Customer satisfaction (CSAT): Captures feedback from employees, suppliers, customers, and business stakeholders regarding service quality.
First-contact resolution (FCR): Measures the percentage of service requests resolved during the initial interaction without additional follow-ups or escalations.
Average resolution time: Tracks the average time required to resolve a service request or operational issue.
Reopened case rate: Measures how frequently previously closed cases return because the original issue was not adequately resolved.
An organization should not rely exclusively on SLA compliance. A service can meet its response-time commitment while still delivering an unsatisfactory resolution. Combining experience metrics with resolution quality provides a more accurate assessment.
4. Risk, Compliance, and Control KPIs
As GBS operations expand across geographies, systems, and business functions, managing operational risk becomes increasingly important.
The following KPIs help monitor control effectiveness:
Control compliance rate: Measures the percentage of applicable transactions or activities that meet established internal control requirements.
Audit finding closure time: Tracks the time taken to resolve identified audit observations and control weaknesses.
Policy violation rate: Measures instances where transactions or activities deviate from approved policies and procedures.
Fraud and duplicate transaction detection rate: Tracks the effectiveness of controls in identifying suspicious payments, duplicate invoices, and unusual transaction patterns.
Compliance exception rate: Measures the frequency of transactions requiring investigation because of regulatory or internal compliance deviations.
A mature GBS KPI framework should measure not only the number of control failures but also how quickly the organization identifies, investigates, and resolves them.
5. Digital Transformation and Automation KPIs
Automation is now central to GBS transformation. However, measuring the number of automated processes or deployed bots does not necessarily demonstrate business value.
Organizations should evaluate technology through operational outcomes.
Important KPIs include:
Automation rate: Measures the proportion of eligible process activities completed through automation without manual execution.
Straight-through processing (STP) rate: Tracks transactions completed end-to-end without human intervention.
Hours saved through automation: Estimates the employee time released through automated workflows compared with an agreed baseline.
Automation success rate: Measures the percentage of automated executions completed successfully without failures or manual recovery.
Cost per automated transaction: Evaluates the operating cost of automated transactions, including technology, maintenance, and exception-handling costs.
AI-assisted resolution rate: Measures the proportion of eligible cases successfully resolved with AI assistance, subject to defined quality and control requirements.
These indicators should be connected to measurable improvements in cost, cycle time, quality, and service experience rather than reported as technology adoption statistics alone.
6. Strategic Business Value KPIs
This category distinguishes a transactional shared services operation from a strategic GBS organization.
Strategic indicators evaluate whether GBS contributes to broader enterprise priorities.
Examples include:
- Working capital improvement: Measures the impact of better payables, receivables, and cash management processes.
- Forecast accuracy improvement: Evaluates whether improved operational data and reporting support more reliable business forecasts.
- Time-to-integrate acquired operations: Measures how quickly new business entities can be incorporated into standardized GBS processes.
- Process standardization rate: Tracks the percentage of processes operating under common enterprise standards.
- Business stakeholder value realization: Measures the extent to which GBS initiatives deliver the outcomes agreed upon with business functions.
These KPIs help leadership understand how GBS supports enterprise agility, financial visibility, and strategic decision-making.
Building a Balanced GBS Performance Scorecard
Tracking dozens of metrics does not automatically improve performance. In fact, excessive reporting can make it difficult for leaders to identify the issues that require attention.
The better approach is to create a balanced scorecard that connects operational indicators with business outcomes.
A recommended structure is:
| KPI Category | Example KPI | Business Outcome |
| Financial | Cost per transaction | Lower operating expenditure |
| Process efficiency | End-to-end cycle time | Faster business operations |
| Quality | First-time-right rate | Reduced errors and rework |
| Service | Customer satisfaction | Better stakeholder experience |
| Risk | Control compliance rate | Reduced operational exposure |
| Automation | Straight-through processing | Higher process capacity |
| Strategic value | Time-to-integrate | Greater enterprise agility |
Each KPI should have a clearly defined owner, measurement frequency, calculation method, baseline, target, and escalation threshold.
For example, the finance operations leader may own invoice processing efficiency, while the GBS risk lead monitors control compliance. The transformation office can oversee automation outcomes and value realization.
This ownership structure ensures that metrics translate into accountability rather than remaining dashboard statistics.
How to Connect GBS KPIs to Business Outcomes
One of the biggest challenges in GBS performance management is demonstrating how operational improvements affect the wider enterprise.
The solution is to establish a clear relationship between process metrics and business results.
Consider three examples:
Accounts Payable: Reducing invoice processing cycle time can help organizations capture early-payment discounts, avoid late-payment penalties, and improve supplier relationships. The operational KPI is invoice cycle time, while the business outcomes include payment efficiency and working capital optimization.
HR Shared Services: Improving first-contact resolution can reduce repeated employee inquiries and administrative workload. The business outcomes include better employee experience, lower service delivery costs, and increased HR capacity for strategic activities.
Procurement Operations: Reducing purchase requisition approval time can accelerate purchasing decisions and improve procurement responsiveness. The wider impact includes reduced operational delays and better supplier coordination.
A strong GBS KPI framework should make these connections visible through business-level reporting.
Instead of presenting a dashboard that simply states that invoice processing time decreased by 20%, leaders should explain how the improvement affected payment performance, supplier experience, and operating costs.
Common Mistakes to Avoid When Measuring GBS Performance
Even organizations with mature reporting capabilities can struggle to measure the right outcomes.
Several mistakes frequently undermine KPI effectiveness.
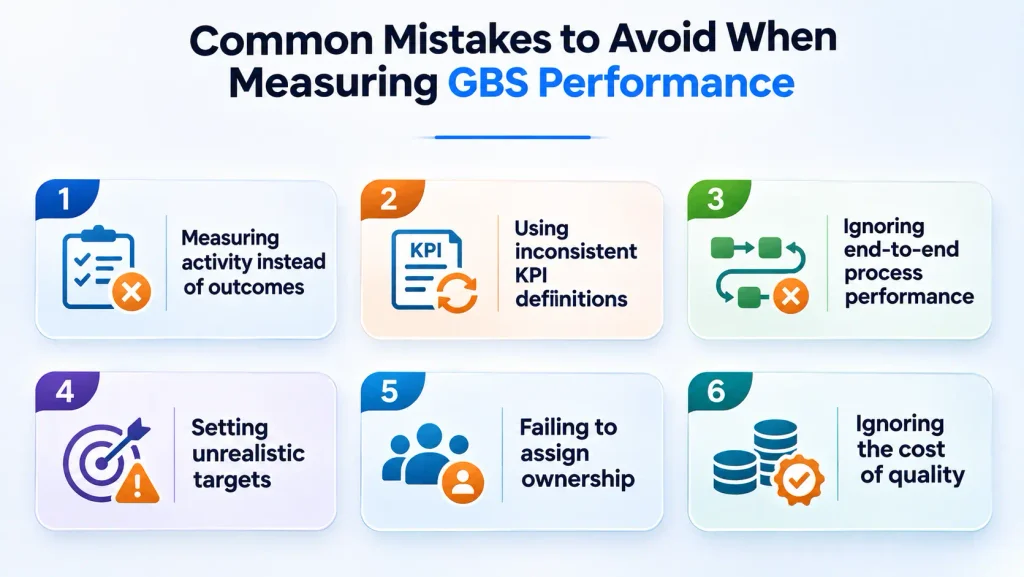
1. Measuring activity instead of outcomes: High transaction volumes and ticket closure rates do not necessarily indicate better performance. Measure resolution quality, accuracy, and business impact alongside productivity.
2. Using inconsistent KPI definitions: Different business units may calculate the same metric differently. Establish standardized definitions, data sources, and calculation rules across the enterprise.
3. Ignoring end-to-end process performance: Measuring individual teams in isolation can hide delays and inefficiencies between functions. Include cross-functional cycle times and handoff performance.
4. Setting unrealistic targets: Targets should reflect historical performance, process complexity, available technology, and business priorities. Arbitrary targets can encourage undesirable behavior.
5. Failing to assign ownership: Every KPI needs an accountable owner who can investigate performance gaps and initiate corrective action.
6. Ignoring the cost of quality: A reduction in processing costs can be misleading if it creates more errors, exceptions, complaints, or downstream rework.
Using AI and Automation to Make GBS Performance Measurement More Intelligent
Traditional reporting often depends on periodic data extraction, manual consolidation, and retrospective analysis. This limits how quickly leaders can identify performance problems.
AI, automation, and process intelligence can improve this model.
Automated data collection can consolidate operational information from ERP, HRIS, ITSM, procurement, and finance platforms. Process mining can identify bottlenecks, recurring deviations, and unnecessary process steps. Predictive analytics can help identify transactions likely to miss SLAs or processes showing early signs of performance deterioration.
Agentic AI can extend these capabilities by coordinating actions across systems, investigating exceptions, preparing recommendations, and initiating approved workflows under defined governance controls.
For example, an intelligent system could identify a growing invoice backlog, analyze the reasons behind processing delays, classify affected transactions, and route exceptions to the appropriate team.
However, organizations must establish reliable data foundations, clear access controls, human oversight, and measurable performance criteria before introducing autonomous actions.
The objective is not simply to automate KPI reporting. It is to create a more responsive operating environment where performance insights lead to timely corrective action.
Conclusion
GBS performance measurement must evolve alongside the role of global business services within the enterprise. Cost savings, transaction volumes, and SLA compliance remain important, but they cannot independently demonstrate the full value of a modern GBS organization.
A balanced measurement approach should connect financial performance, process efficiency, service quality, risk management, digital transformation, and strategic business outcomes.
The real value of a GBS KPI framework lies in its ability to turn operational data into actionable business intelligence. When metrics have clear ownership, consistent definitions, meaningful targets, and direct links to enterprise priorities, GBS leaders can make better decisions and demonstrate their contribution beyond cost reduction.
Ultimately, the goal is to move from measuring how much work GBS completes to understanding how much value it creates for the business.