Key Takeaways
- With GPT-4o, non-technical users can run sophisticated forecasting and variance analysis simply by asking questions in plain English—no code, no dashboards, no delay.
- LangGraph automates backend tasks like data ingestion, decomposition, and modeling, enabling real-time analytics that previously required full data science teams.
- From STL decomposition to ACF/PACF interpretation and stationarity checks, users are guided through technical concepts with conversational clarity and visual feedback.
- Whether it’s predicting patient inflow, retail demand, machine maintenance, or energy usage, GPT-4o + LangGraph reduces guesswork and improves precision across sectors.
- Forecasting is no longer just about numbers—it’s a conversation. Businesses can test hypotheses, simulate scenarios, and make agile decisions with unprecedented speed.
Forecasting and variance analysis are foundational to decision-making in today’s volatile business environment. Yet traditional methods often require technical expertise, siloed tools, and static dashboards. Enter GPT-4o and LangGraph—a dynamic duo that democratizes forecasting by turning it into a natural, conversational process. From supply chains to patient inflows, this blog examines how AI-powered dialogue transforms raw time-series data into actionable, meaningful, and explainable insights. This transformation doesn’t just improve technical workflows; it redefines who can participate in forecasting conversations, opening doors for decision-makers across departments.
Also read: Forecast Accuracy in Seasonal Industries: How LLMs Are Changing the GAME.
Why Forecasting and Variance Analysis Are Essential?
In industries ranging from retail and finance to healthcare and energy, forecasting serves as the strategic compass that guides operations, resource planning, and growth. Accurate forecasts inform everything from inventory purchases and marketing spend to patient staffing and utility grid management. But beyond forward-looking predictions lies an equally vital function: variance analysis.
Variance analysis is the post-mortem that tells you why your forecast deviated from reality. It uncovers hidden insights, such as external disruptions or overlooked seasonal patterns, which can refine future forecasts. These insights enable agile adjustments in strategy, avoiding repeat mistakes and seizing unforeseen opportunities.
Imagine asking, “Why did our ad campaign underperform in Q3?” or “What caused last month’s spike in machine downtime?” With GPT-4o and LangGraph, such questions no longer need to route through analysts or complicated BI dashboards. You just ask.
Meet the Tools Powering Forecasting Transformation
Some of the best tools powering forecasting transformation are:
GPT-4o: Your Conversational Forecasting Assistant
OpenAI’s GPT-4o model is built for multimodal, natural interaction. It understands language, code, visuals, and audio, making it ideal for use cases that blend narrative with technical depth. As a forecasting assistant, it eliminates the barrier of scripting and querying languages, allowing users to converse with their data like they would with a colleague.
Instead of asking an analyst to code a time series model, a marketing manager can simply ask, “Show me sales trends over the last three quarters,” and receive charts, analysis, and model-backed insights. The complexity is abstracted away, but the sophistication remains.
LangGraph: The Workflow Orchestrator
LangGraph turns natural language into structured workflows, orchestrating tasks such as:
- Data ingestion from spreadsheets or databases
- Data cleansing and preprocessing
- Decomposition of time-series elements
- Model fitting (ARIMA, ETS, STL, etc.)
- Evaluation and error diagnostics
- Generation of visual explanations
When combined, GPT-4o and LangGraph deliver the kind of responsive, on-demand forecasting power that previously required entire data science teams.
Understanding Time-Series Fundamentals
Before any forecasting begins, you need to understand the structure of your time-series data. GPT-4o guides users through these fundamental elements:
- Trend: The overall direction of the data is moving over time (e.g., gradual sales growth).
- Seasonality: Predictable, repeating patterns such as weekend dips or holiday spikes.
- Cycle: Longer-term fluctuations are influenced by macroeconomic or environmental factors.
- Noise: Random, unexplained variations that can skew analysis.
By decomposing a time series into these components, GPT-4o helps users identify the right modeling strategy and avoid misleading conclusions.
Decomposition Techniques Made Simple
To isolate patterns within time-series data, users can choose from several decomposition methods:
- Additive Decomposition: Assumes components sum together. Suitable when seasonal fluctuations are consistent over time.
- Multiplicative Decomposition: Assumes components multiply. Useful when seasonal effects grow proportionally with the trend.
- STL (Seasonal-Trend-Loess): A powerful, flexible method for separating non-linear seasonality and trends.
Example command: “Use STL to decompose last year’s patient admission data.” GPT-4o handles the math and delivers charts with clear explanations.
Advanced Pattern Recognition: ACF and PACF
Time series forecasting often hinges on how past values influence the present. Two techniques help uncover these relationships:
- Autocorrelation Function (ACF): Identifies correlation between current and past values at varying lags.
- Partial Autocorrelation Function (PACF): Shows the direct relationship between a point and its lag, removing intermediate lag effects.
These plots inform model parameters, such as AR (autoregressive) and MA (moving average) terms, in ARIMA models. GPT-4o can generate, explain, and apply them for precise modeling.
Is Your Data Stationary? Here’s How to Tell
Stationarity means your data’s statistical properties don’t change over time—a key assumption in many models. GPT-4o can apply the Augmented Dickey-Fuller (ADF) test to determine this.
If your data is non-stationary, GPT-4o will recommend transformations such as:
- Differencing: Subtracting previous values
- Logarithmic scaling: Smoothing large fluctuations
- Seasonal adjustment: Removing recurring patterns
You can simply ask, “Make this dataset stationary,” and receive transformed outputs with rationale.
Forecasting Models Available Through Dialogue
1. ARIMA (AutoRegressive Integrated Moving Average)
Suitable for univariate time series with consistent autocorrelation. GPT-4o assists in selecting optimal p, d, and q values through trial, diagnostics, and validation.
2. Exponential Smoothing (ETS)
Emphasizes recency while accounting for trend and seasonality. Excellent for rapidly changing business environments.
LangGraph structures the modeling process, while GPT-4o handles analytics. You might say:
“Forecast the next 12 months using ARIMA, then ETS. Compare performance and error rates.”
Model Evaluation and Tuning
Forecasting without validation is risky. GPT-4o applies rigorous evaluation metrics:
- AIC/BIC: Balance accuracy with model simplicity
- RMSE/MAE: Quantify forecast error
Advanced techniques like walk-forward validation and backtesting can be invoked by saying, “Evaluate model stability with walk-forward validation.” GPT-4o provides visualizations and interpretation.
Visualizing the Forecasted Future
Effective forecasts are both accurate and easy to interpret. GPT-4o generates:
- Line charts with forecast intervals
- Comparison plots of actual vs. predicted values
- Residual analysis to spot model flaws
- Annotated graphs with callouts for anomalies
Crucially, it also interprets visuals: “April’s sales dropped due to an unaccounted holiday. Not a model flaw.”
Real-World Example: Healthcare Operations
Scenario: A hospital operations director needs to forecast patient inflow to schedule staffing.
Query: “Decompose weekly patient admissions. Forecast Q3 inflow. Explain variance from last year.”
GPT-4o and LangGraph will:
- Clean data and detect seasonality
- Apply STL decomposition
- Run ARIMA and ETS models.
- Generate a visual and numeric comparison.
- Highlight key differences (e.g., flu severity last year)
Outcome: Informed staffing decisions based on explainable forecasts.
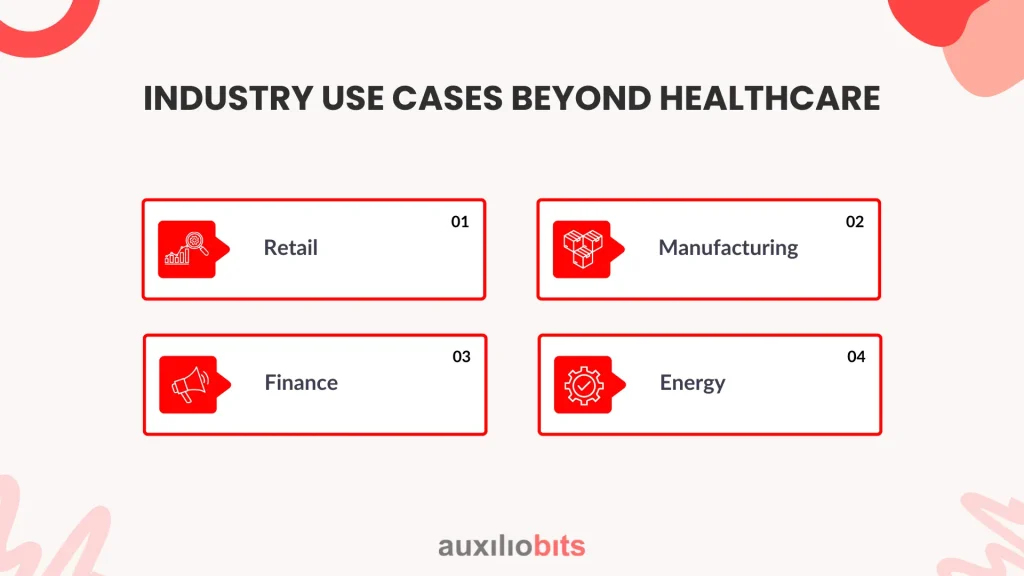
Industry Use Cases Beyond Healthcare
Retail
- Forecast seasonal demand
- Analyze promotional performance variance.
Manufacturing
- Predict machine maintenance windows.
- Manage input variance and waste.
Finance
- Model future cash flows
- Simulate market risk scenarios.
Energy
- Estimate seasonal usage
- Detect grid anomalies and prevent outages.s
Each of these industries benefits from reduced guesswork and improved agility.
Conversational Forecasting: A Paradigm Shift
Traditional Forecasting:
- Complex tools
- Specialist access
- Siloed insights
Conversational Forecasting:
- Instant access
- Clear, visual results
- Collaborative use across teams
You can:
- Simulate what-if scenarios
- Test assumptions live
- Adjust strategy in real time.
Conclusion: A Forecastable Future
Forecasting variance analysis is no longer the domain of technical specialists. With GPT-4o and LangGraph, anyone can explore, question, and act on time-series insights. By making data dialogue-based, organizations unlock new speed, agility, and clarity in decision-making.


