







Key Takeaways
- Evaluating Agentic AI is complex as it requires multidimensional assessment across reasoning accuracy, decision autonomy, and exception handling, unlike traditional automation that relies on more straightforward metrics.
- Core evaluation dimensions include Effectiveness, Efficiency, Autonomy, Accuracy, and Robustness, with advanced metrics like LLM Cost per Task, Hallucination Rate, and Context Utilization Score providing more profound insights.
- Instrumentation is essential for tracking performance. Using tools like OpenTelemetry and Grafana, detailed logging is performed at each agent decision point to capture task success, tool interactions, and LLM reasoning.
- Benchmarking strategies ensure reliability through Synthetic Task Benchmarks that simulate real-world scenarios, Real Task Replays for enterprise-specific performance evaluation, and Human-in-the-Loop Feedback for refining agent behavior.
- Choosing the right tech stack is crucial, with agent frameworks like LangChain or CrewAI, observability tools like Prometheus or Datadog, and SQL/NoSQL databases for task outcome storage.
- Continuous improvement is achieved by integrating feedback into retraining pipelines, ensuring agents align with business goals and consistently meet KPIs.
- Building trust in Agentic AI requires transparent evaluation, clear reporting, and treating agents as evolving decision-makers rather than static automation tools.
As enterprises adopt Agentic AI—autonomous systems capable of planning, reasoning, and acting—there’s growing pressure to measure their value objectively. While large language models (LLMs) are evaluated on benchmarks like MMLU or TruthfulQA, enterprise stakeholders need something different.
How do we measure the real-world performance of agents executing business-critical workflows?
This blog explores how to evaluate Agentic AI in enterprise contexts. We’ll define key KPIs, discuss architectural touchpoints for instrumentation, and provide benchmarking strategies aligned with business outcomes.
Also read: The Tech Stack Behind Agentic AI in the Enterprise: Frameworks, APIs, and Ecosystems
The Problem Space: Why Evaluation Is Hard?
Traditional automation (like RPA) is evaluated using binary metrics—success/failure, time saved, and error reduction. Agentic AI adds cognitive complexity, such as:
- Reasoning accuracy across multi-step tasks
- Goal alignment with dynamic instructions
- Context retention over long conversations
- Tool selection decisions under ambiguity
- Handling exceptions when APIs fail or data is missing
You’re no longer testing “Did the bot click the button?” but “Did the agent make the right decision across seven steps?”
Challenges include:
- Lack of standard metrics for autonomy or reasoning quality
- Black-box behavior from LLMs
- Tool/API errors affecting task success (not always the agent’s fault)
- Evaluating subjective goals (e.g., “Did it summarize well?”)
What to Measure: Core Evaluation Axes?
Here’s a framework for thinking about evaluation across five key dimensions:
| Dimension | KPI | Description |
| Effectiveness | Task Success Rate | % of agent-initiated tasks completed end-to-end correctly |
| Efficiency | Avg Task Duration | Time taken vs baseline automation or manual process |
| Autonomy | Decision Turn Count | # of actions taken without human intervention |
| Accuracy | Tool/Action Selection Accuracy | Did the agent choose the right API/tool at each step? |
| Robustness | Recovery Rate | % of failures recovered through retry, fallback, or clarification |
Optional advanced metrics:
- LLM Cost per Task (tokens consumed × model cost)
- Hallucination Rate (especially in summarization or generation)
- Latency Per Agent Loop (for responsiveness tuning)
- Context Utilization Score (how much memory or past context is used)
Solution Architecture: Instrumenting the Agent
Your agent platform must be instrumented with observability hooks to track these KPIs.
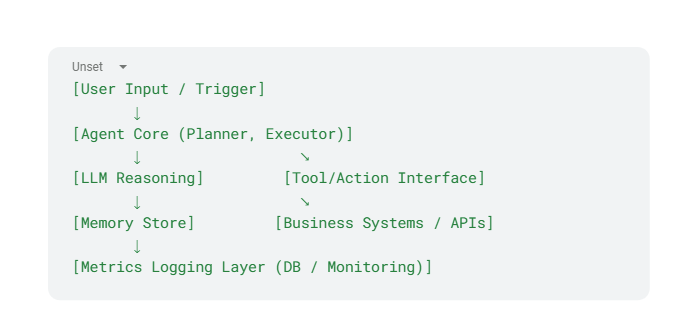
Instrumentation Points:
- Log every agent step with timestamp, action taken, and tool used
- Log inputs/outputs from LLMs for later replay or audit
- Tag failure types: hallucination, timeout, tool error, misinterpretation
- Track token usage and latency for each reasoning call
- Capture human override rate if there’s fallback to a human-in-the-loop
Technology Stack Consideration
| Layer | Stack Options |
| Agent Framework | LangChain, CrewAI, Autogen |
| Observability | OpenTelemetry, Prometheus, ELK, Datadog |
| Task Outcome Store | SQL/NoSQL DB, Vector DB with feedback tagging |
| Evaluation Pipelines | Custom scripts, LangSmith, HumanEval-style tests |
| Metrics Dashboard | Grafana, Power BI, Streamlit (for exec visibility) |
Benchmarking Approaches
To go beyond anecdotal testing, enterprises need structured benchmarks:
1. Synthetic Task Benchmarks
Create a set of 50–100 simulated prompts across common workflows:
- “Download the latest sales data, clean it, and upload to SharePoint.”
- “Monitor server metrics and open a JIRA ticket if CPU > 80%.”
Evaluate each version of your agent on:
- Task success %
- Token cost
- Latency
- Memory usage
- Action accuracy (compare expected tool vs chosen tool)
2. Real Task Replay
Replay anonymized, historical tickets or workflows to evaluate real-world performance—ideal for finance, IT, and support tasks.
3. Human-in-the-loop Feedback
Collect structured feedback:
- 👍/👎 on agent performance
- Clarification vs failure vs hallucination tags
- Feedback loop integration for agent retraining
Agentic AI KPIs for Finance & AP Teams
For finance and accounts payable teams, evaluating Agentic AI requires more than measuring whether an agent completes a task. The metrics need to connect AI performance with measurable finance outcomes such as processing cost, invoice cycle time, exception workload, matching accuracy, and straight-through processing. This creates a practical bridge between enterprise AI evaluation and the operational KPIs already used by finance and GBS leaders.
Core Finance and AP Metrics
- Touchless rate measures the percentage of invoices processed from receipt through the next required step without human intervention. A higher touchless rate generally indicates that the agent can handle routine invoices independently, while a lower rate may indicate data-quality issues, complex approval rules, or insufficient automation coverage. Track this metric by invoice type, supplier, entity, and exception category rather than relying only on an overall percentage.
- Cost per invoice provides a direct financial measure of automation impact. Calculate the fully loaded cost of processing an invoice before automation and compare it with the cost after implementation, including technology, support, human review, and exception-handling costs. This is an important input into an AP automation business case because it connects operational improvements with measurable financial value.
- Exception rate measures the percentage of invoices that require human review because the agent cannot confidently complete the workflow. Monitoring both the overall exception rate and the reasons behind exceptions helps teams identify where additional rules, better supplier data, or improved agent capabilities are needed.
- Cycle time measures the elapsed time from invoice receipt to approval and payment. Agentic workflows can reduce delays by handling classification, validation, matching, routing, and follow-up automatically. Comparing median and 90th-percentile cycle times can reveal bottlenecks that an average alone may hide.
- First-pass match rate measures how often invoices successfully pass two-way or three-way matching without manual intervention. Finance teams should separately track purchase-order, receipt, and invoice matching accuracy to understand where mismatches originate.
Benchmarking Against Industry Standards
There is no single universal benchmark for agentic AI performance because results depend heavily on invoice mix, ERP configuration, supplier behavior, geography, and process maturity. Instead, establish a baseline using historical AP data and compare performance against relevant industry or peer benchmarks where definitions are consistent.
For example, measure touchless rate, exception rate, cost per invoice, and cycle time for several months before deployment. After implementation, compare the same metrics using identical definitions. This provides a more meaningful measure of improvement from agentic process automation than comparing an organization’s results with a generic automation percentage.
The same principle applies when calculating automation ROI. Savings should account for labor capacity recovered, reduced exception handling, faster processing, lower error-related costs, and technology operating costs.
Metrics for Reconciliation and Financial Close
For reconciliation automation, useful KPIs include automated match rate, unreconciled balance, exception rate, time to resolution, manual adjustments, and reconciliation completion time.
For close automation, track close-cycle duration, percentage of reconciliations completed automatically, journal-processing time, late close tasks, intercompany exceptions, manual journal volume, and the number of adjustments required after close.
These metrics help determine whether agentic process automation is improving the entire finance workflow rather than simply automating individual tasks.
Building a Dashboard for GBS Leadership
GBS and shared-services leaders should avoid dashboards overloaded with technical AI metrics. An executive dashboard should connect agent performance with business outcomes.
A practical dashboard can include four layers:
- Operational: touchless rate, exception rate, cycle time, first-pass match rate.
- Financial: cost per invoice, labor hours recovered, savings, and automation ROI.
- Quality: error rate, duplicate invoices, rework, and matching accuracy.
- Agent performance: task success, human override rate, recovery rate, latency, and AI cost per task.
Finance leaders evaluating AI agents in finance should also segment these metrics by business unit, geography, ERP, supplier group, and process type. This makes it easier to identify where agents are performing reliably and where additional controls or process improvements are required.
The objective is not simply to show that an AI agent is active. It is to demonstrate whether the agent is making finance operations faster, more accurate, more scalable, and less dependent on manual intervention while maintaining appropriate human oversight.
AP Efficiency Assessment
Measure your AP process baseline before implementing agentic AI. Free, 3 minutes, instant results. Start your AP efficiency assessment now.
Conclusion
As enterprises scale their use of Agentic AI, rigorously evaluating these systems is critical. Don’t treat them as “just chatbots”—they are evolving knowledge workers with decision-making autonomy.
You can turn agent development from art to science and build trust in AI-driven automation by tracking the right metrics- from success rates to reasoning steps. To learn more, get in touch with us today.