


Key Takeaways
- Selecting the wrong AP automation platform can create long-term inefficiencies and significantly increase processing costs, making vendor evaluation just as important as the decision to automate.
- Touchless processing rate is one of the strongest indicators of platform performance. Leading solutions can process nearly half of all invoices without human intervention, reducing costs, delays, and manual effort.
- Vendor claims should always be validated with documented customer outcomes, measurable case studies, and industry-specific references rather than relying solely on product demonstrations.
- Native ERP integrations provide faster deployments, better data accuracy, and fewer operational risks compared to middleware-based connections that often introduce additional complexity.
- Building a business case using current processing costs, missed early-payment discounts, and error-related rework expenses helps organizations quantify ROI and make faster, data-driven purchasing decisions.
You are not here to learn what AP automation is. You are here to buy the right one — and not get burnt. This guide skips the definitions and gives you case-study proof, sourced benchmarks, and a vendor evaluation framework so you walk into every demo with the right questions.
The Cost of Getting This Wrong
Most AP automation buying decisions are made on demos, not data. The result: teams pick platforms with impressive UIs but weak matching engines, then spend 18 months manually reviewing exceptions their automation was supposed to eliminate.
The gap between a mediocre and a best-in-class AP automation platform is not marginal. It is the difference between $13.54 per invoice and $2.98 per invoice — a 78% cost gap (PLANERGY, 2025). At 10,000 invoices per year, that is $107,000 in annual waste from a single wrong vendor selection.
The stakes are concrete: only 9% of AP departments are fully automated today (Institute of Financial Operations & Leadership, 2024). The 91% still on manual or partial workflows are paying late fees, missing early-payment discounts, and closing books 3 weeks behind schedule — every single month. The question is not whether to automate. The question is which platform delivers the highest touchless processing rate for your specific invoice mix, ERP, and approval structure.
What Accounts Payable Automation Actually Covers
Before evaluating vendors, align on what you are buying. Accounts payable automation is the end-to-end use of OCR, machine learning, and workflow orchestration to capture invoices from any source, validate and match them against POs and goods receipts, route them for approval without email, post them to your ERP without rekeying, and execute payment — with a full audit trail throughout.
In 2025, best-in-class platforms achieve 49.5% touchless processing rates — meaning nearly half of all invoices flow from receipt to payment with zero human intervention (PLANERGY, 2025). If a vendor cannot show you their touchless rate across their customer base, they are not best-in-class.
The AP automation market reached $1.47 billion in 2025, growing at a 14% CAGR, and 51% of CFOs in high-performing organizations now use AI-driven AP tools (PLANERGY, 2025). This is not an emerging category. It is a mature one with a wide quality distribution between vendors. Picking the wrong one is the real risk.
Six Real Companies. Documented Results. No Marketing Language
These are published case studies with specific, verifiable outcomes — not vendor testimonials with vague percentage claims. Use them as your baseline for what realistic results look like, and as reference points when vendors promise similar outcomes.
| Company | Documented result | Platform / Source |
| REVA Air Ambulance | 15–20 min → under 3 min per invoice. Month-end close cut by 3 weeks. | Ramp Bill Pay + Sage Intacct, 2026 |
| Liberty Fence & Supply | $32,000 in early-payment discounts captured annually — previously $0. | MakersHub + QuickBooks, 2025 |
| Molina Healthcare | Scaled through 420% invoice growth with only 10% additional headcount. | Coupa, 2026 |
| Reddit (pre-IPO) | 60% faster close cycle. $6M attributed savings. Clean audit trail for IPO. | Coupa, 2026 |
| Moët Hennessy (LVMH) | 99.6% data extraction accuracy. Multi-language invoice processing at scale. | Staple AI, 2025 |
| Paseo Advisors (finance firm) | AP sessions reduced from 12 hours to 2.5 hours. 1-hour client onboarding. | MakersHub, 2025 |
The ROI of AP automation is that AP is not involved in outbound partner payments. That’s huge.” — Tipalti customer, published case study, 2025
Notice what these results have in common: they are all measurable, specific, and tied to a platform and a timeline. If a vendor offers you a case study with language like ‘significantly reduced processing time’ without a number, ask them to be specific. Vague proof is not proof.
What the Numbers Should Look Like — And What to Demand From Vendors
The table below provides the industry benchmarks for manual versus automated AP, along with the specific question to ask every vendor you evaluate. Any vendor who cannot answer column four with data, not talking points, should be disqualified.
| Metric | Manual AP | Automated AP | Question to ask every vendor |
| Cost per invoice | $13–$30 | $2–$5 (best-in-class: $2.98) | Ask for a benchmark specific to your industry vertical |
| Processing time | 10–14 days | 2–4 days | Request average cycle time across their customer base |
| Touchless processing rate | < 10% | 40–49.5% | Ask: what % of invoices require zero human touch? |
| Early-pay discount capture | < 20% | > 80% | Ask how the platform surfaces discount windows |
| Duplicate payment rate | ~1.3% | < 0.01% | Ask exactly how duplicates are detected and blocked |
| Month-end close impact | 3-week delays | Close by day 4–5 | Request a customer reference who will confirm close times |
| Fraud detection | Manual review | AI flags anomalies in real time | Ask what % of transactions are screened — should be 100% |
One number to anchor your expectations: invoice approval cycles across the industry dropped from 3.7 days in 2024 to 3.2 days in 2025 (PLANERGY, 2025) — and that average is dragged up by underperformers. Best-in-class teams are already below 2 days. Hold vendors to that standard, not the industry average.
The 8-Point Vendor Evaluation Checklist
Finance teams that complete a structured vendor assessment before selecting a platform achieve 25–40% higher ROI than those who implement based on demos alone (IOFM Best Practices Study, 2024). Use this checklist in every vendor call. If a vendor cannot meet the minimum standard, document it. Your CFO will want to see that you asked.
| Criterion | Minimum standard | Why it matters / red flag |
| ERP integration | Native connector (not middleware) to your specific ERP | If they route through Zapier or MuleSoft, latency and failure risk go up significantly |
| OCR / AI accuracy | Documented ≥ 98% extraction accuracy | Ask for accuracy data from customers in your invoice format — PDFs vs EDI vs email attachments differ |
| Touchless rate | > 40% of invoices processed without human touch | Below 30% means their AI matching is weak — your team will still be babysitting invoices |
| Implementation SLA | Contractual go-live date, not an estimate | 4–8 weeks is standard for mid-market. No contractual date = a warning sign |
| Customer references | ≥ 2 references in your industry and company size band | Ask them to connect you directly — vendors who hesitate have something to hide |
| Pricing transparency | Per-invoice or flat-fee model, fully modeled on your volume | Model three scenarios: current volume, 2× growth, 5× growth |
| Fraud & duplicate logic | 100% transaction screening, not sample-based | Ask specifically whether duplicates are caught pre-payment or flagged after the fact |
| Support escalation | Named CSM + SLA for invoice processing failures | A stalled invoice costs real money. Understand exactly who you call at 11 PM |
The integration question is the one most teams get wrong
Native ERP connectors — not middleware — are the single biggest differentiator between platforms. A solution routing through Zapier or MuleSoft introduces latency, failure points, and reconciliation gaps your team will be managing manually. Ask every vendor explicitly: is your connection to our ERP a native, certified integration, or does it go through middleware? If they cannot name the connector and its certification status, that is a warning sign.
Insist on a contractual go-live date
Standard mid-market AP automation implementations take 4–8 weeks. If a vendor cannot commit to a go-live date in the contract, your implementation will slip — and every week of delay is another week paying $13.54 per invoice instead of $2.98. Contractual SLAs on implementation are non-negotiable for any serious vendor.
Build Your Internal Business Case in 48 Hours
Your CFO needs three numbers. Calculate them before you finalize vendor selection — not after.
- Current cost per invoice: Total AP department cost (salary + overhead + error correction time) ÷ annual invoice volume. Most teams land between $15 and $40. If you are below $10, challenge the number — hidden costs are usually being left out.
- Annual missed discount value: Total annual payables × 1% = conservative estimate of early-payment discounts your current cycle time is too slow to capture. On $5M in payables, that is $50,000 per year in captured value that automation unlocks from day one.
- Error and rework cost: Hours per month spent resolving duplicate payments, mismatched invoices, and escalations × fully loaded labor rate. Track the total for two weeks if you do not have it. The number is almost always larger than anyone expected.
Add these three figures. That is your annual waste number. Divide it by the fully loaded annual cost of the platform you are evaluating. If the result is below 1.0, the platform pays for itself in less than 12 months. Most mid-market teams see a payback period of 6–9 months.
Organizations completing this structured assessment before vendor selection achieve 25–40% higher ROI because they configure the system to solve their specific bottlenecks, not generic ones (IOFM, 2024). This exercise takes 48 hours. The wrong vendor selection costs 18 months.
Three Decisions You Need to Make This Quarter
The AP automation category has matured, the ROI has been proven, and the implementation timelines are short. If you are still on manual or partially automated AP, here is what the delay is costing you:
- Every month of delay on 5,000 invoices/year at a $10 cost differential = $4,167 in preventable waste per month.
- Every missed discount window on $5M annual payables at 1% = $50,000 per year that your vendors are offering and you are not collecting.
- Every manual close cycle costs your finance team 15–20 hours of reconciliation work that automation eliminates — time that should go toward cash flow forecasting and strategic analysis.
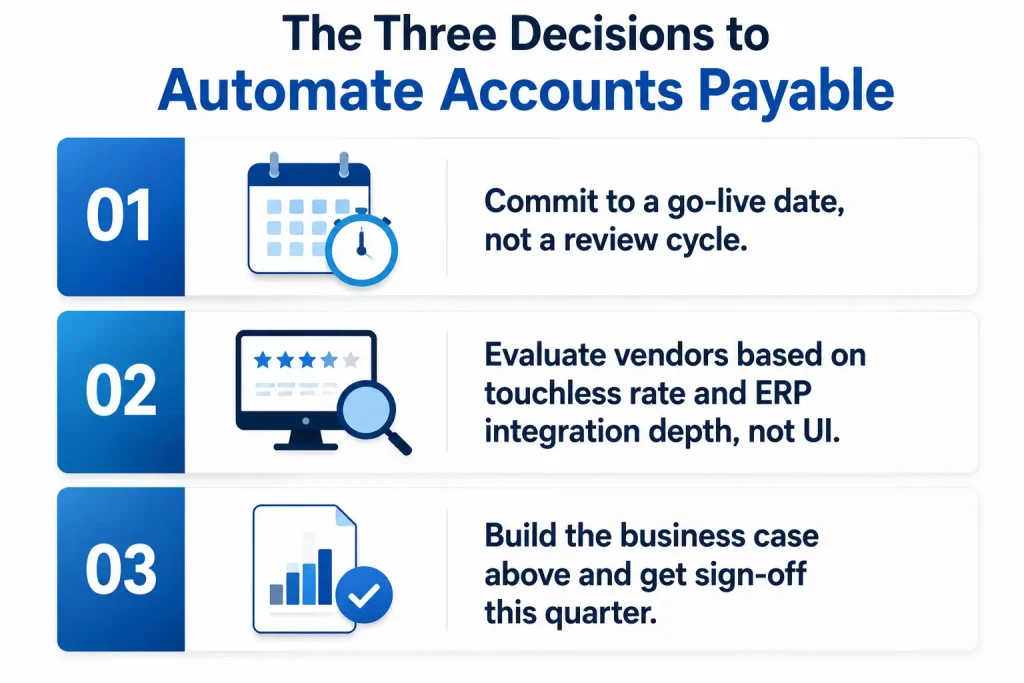
The three decisions: (1) Commit to a go-live date, not a review cycle. (2) Evaluate vendors based on touchless rate and ERP integration depth, not UI. (3) Build the business case above and get sign-off this quarter. The companies in the case study table above did not wait for the right moment. They picked a platform, set a go-live date, and started capturing returns. The question is whether your competitors do it first.
Ready to Stop Funding the Inefficiency?
Use the three-number framework above to calculate your current annual waste, then bring that number into your next vendor demo. Ask them to model your specific ROI — not a generic one. Vendors who can do that with precision are the ones worth your time.