


Key Takeaways
- The true cost of AP processing is often much higher than organizations realize because labor, exception handling, approval delays, lost discounts, and reconciliation efforts are rarely measured together in a single calculation.
- AP dashboard metrics such as cycle time, exception rate, touchless processing, discount capture, and invoices per FTE can be directly translated into financial impact, making them powerful tools for building a business case for automation.
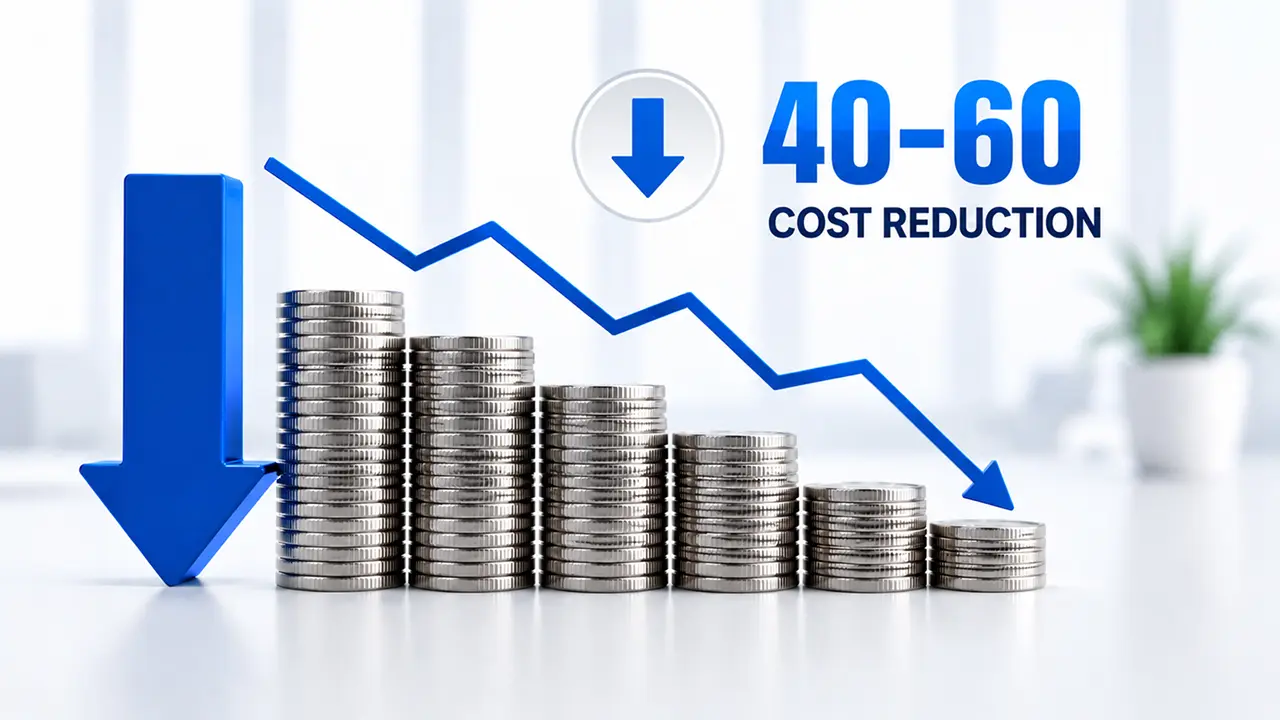
- Organizations that automate accounts payable processes commonly achieve 40–60% cost reductions by reducing manual work, increasing straight-through processing, minimizing exceptions, and accelerating approvals.
- Delaying AP automation has a measurable financial cost. Every month spent evaluating or postponing implementation can result in thousands of dollars in missed savings, lost discounts, and ongoing operational inefficiencies.
- The strongest AP automation business cases are built using an organization’s own operational data rather than industry benchmarks, allowing finance leaders to demonstrate clear ROI, justify investment, and accelerate stakeholder approval.
You’ve evaluated the vendors. You’ve sat through the demos. You already know manual AP is costing you. This guide has one purpose: to show you, in dollars, what your own dashboard metrics say you’re missing and what it takes to close that gap.
If you recognise any of these, this guide is for you
- Your AP team is spending more than 30% of their week chasing approvals, resolving exceptions, or correcting data entry errors.
- You’re capturing less than 30% of the early-payment discounts your suppliers offer — and the reason is simply that invoices don’t move fast enough.
- Your cost per invoice is somewhere between $10 and $25 — and you’re not entirely sure of the exact number because nobody has calculated it honestly.
- You’ve looked at AP automation before, got overwhelmed by vendor claims, and deferred the decision. But the cost of deferral is now higher than the cost of acting.
The question isn’t whether you can reduce AP processing costs. The data on that is settled — automation delivers 40–84% cost reduction in virtually every documented deployment. The question is why your organisation hasn’t captured it yet and what it will actually take to do so.
This guide skips the introductory material. You know what AP automation is. What you need is a clear-eyed look at your numbers, a realistic understanding of where the cost reduction actually comes from, and an honest answer to the objections that have slowed your decision.
The cost you’re paying right now — broken down honestly
Most AP teams track cost per invoice as a line item: staff salaries divided by invoice volume. That number is always understated. The true cost per invoice includes five categories that rarely appear in the same report:
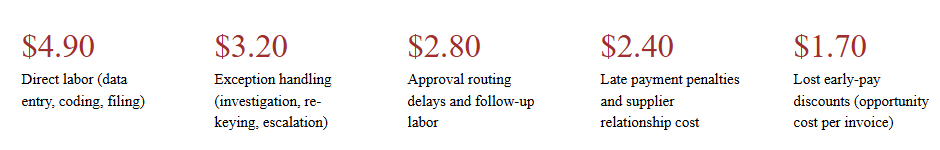
That’s $15 per invoice before you factor in audit, compliance, and duplicate recovery. For a team processing 3,000 invoices per month, the annual bill is $540,000 — and most of it is invisible in standard reporting because it is spread across departments, absorbed as “just the way things work,” and never totalled in one place.
The number that should shock you is not the $15. It’s the gap: best-in-class automated AP costs $2.36 per invoice. The delta — $12.64 per invoice — is not just a rounding error. At 3,000 invoices per month, it’s $455,000 per year in recoverable cost sitting inside your existing operations.
What your AP homepage is already telling you — and how to read it as a cost map
Every modern AP platform surfaces six metrics on its homepage or summary dashboard. Finance leaders check these weekly. Almost none use them to calculate the specific dollar cost of each metric’s gap from best-in-class. Here’s how to do that in 10 minutes.
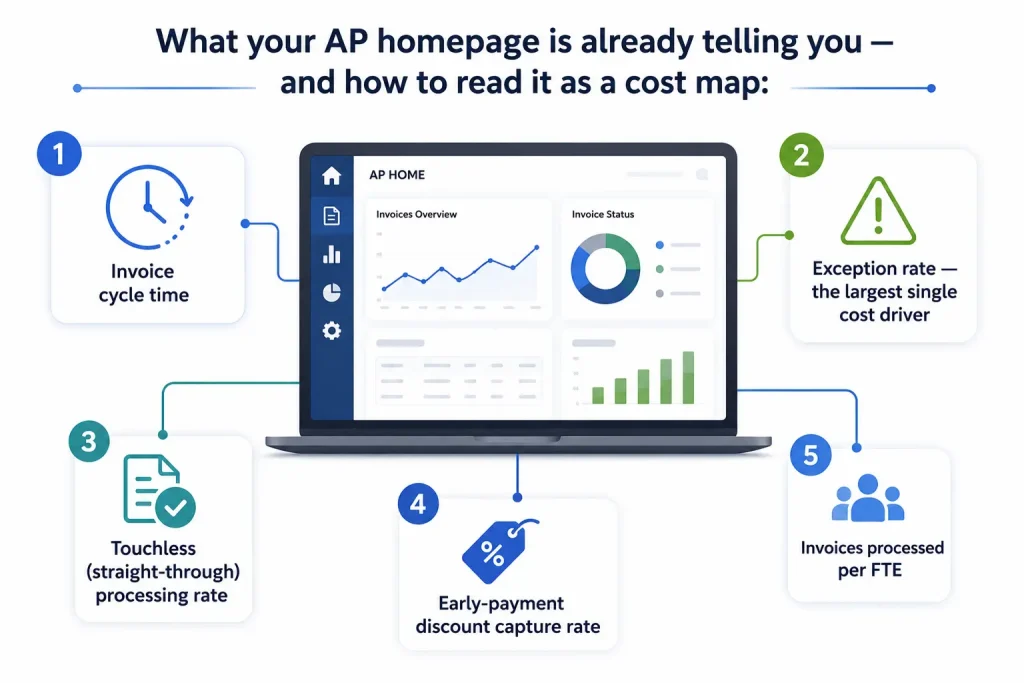
1. Invoice cycle time
Every day beyond 3 days costs you in one of two ways: late payment penalty exposure, or a lost early-pay discount window. Take your current average cycle time, subtract 3, and multiply by the daily penalty rate for your highest-volume supplier tier. That’s your cycle-time cost – and it compounds monthly.
Industry avg: 10.4 days
Best-in-class: 1.8 days
2. Exception rate — the largest single cost driver
Each exception requires an average of 28 minutes of staff investigation. Multiply your monthly exception count by 28 minutes by your blended AP hourly rate. Most teams calculating for the first time find their exception-handling cost exceeds their entire direct data entry cost. An exception rate above 15% is where half your processing cost hides.
High-cost zone: above 20%
Automated target: below 4%
3. Touchless (straight-through) processing rate
This metric is the cleanest cost lever on your dashboard. Every 10 percentage points of improvement in touchless rate reduces your cost per invoice by approximately $1.50. If you’re at 35% touchless today and move to 80% — that’s a $6.75 per invoice reduction on every invoice, every month, indefinitely.
Most manual teams: 20–40%
Automated teams: 78–92%
4. Early-payment discount capture rate
Suppliers offering 2/10 Net 30 terms are providing a 2% discount for paying 20 days early. That’s equivalent to a 36.5% annualised return on your payment. Manual teams capture under 20% of available discounts because invoices don’t clear approval in time. For a company with $10M in payables, recovering this gap is worth $140,000–$180,000 per year, often more than the cost of the automation software.
Manual teams capture: under 20%
Optimised teams capture 72–85%.
5. Invoices processed per FTE
If your ratio is under 5,000 invoices per AP FTE per year, your team is spending most of their time on tasks that should be handled by software. The strategic opportunity isn’t headcount reduction — it’s redeployment to vendor negotiations, spend analytics, and cash flow optimisation. Automated AP teams run at 15,000–23,000 invoices per FTE, which means your same team becomes 3–4x more valuable without adding anyone.
Industry average: ~2,000–3,000/yr
Automated teams: 15,000–23,000/yr
The single most important thing you can do this week: pull these five numbers from your AP dashboard, drop them into the cost calculation below, and show the resulting annual figure to your CFO. That calculation — not a vendor pitch — is what moves budget approvals.
The cost of waiting — calculated honestly
The most common reason AP automation projects stall is not budget. It’s the belief that a decision next quarter costs roughly the same as a decision this quarter. That belief is wrong, and here’s why.
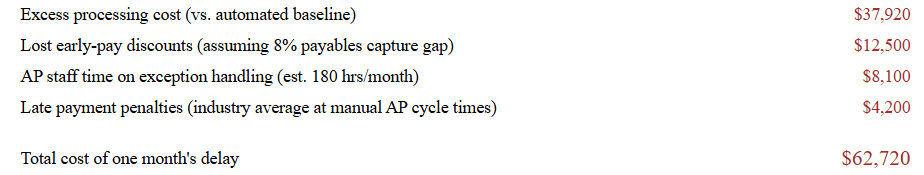
A three-month procurement cycle – vendor evaluation, legal review, and contract negotiation – costs $188,160 in foregone savings at this volume. That’s the business case for urgency, and it doesn’t require a vendor to manufacture it. It comes directly from your numbers.
What 40–60% cost reduction actually looks like — three documented examples

The AP Controller’s starting point was a dashboard showing a $21.40 cost per invoice. The headline problem — a 31% exception rate — is traced almost entirely to two root causes: inconsistent PO formats from 40 top-tier suppliers and a lack of automated 3-way matching.
After deploying a supplier portal for standardised invoice submission and enabling AI-powered 3-way matching, the team reduced the exception rate to 5.2% within 90 days. Touchless processing rose from 28% to 76%. The cycle time dropped from 14 days to 4.1 days — long enough for the team to start capturing early-pay discounts on 61% of eligible invoices.
Twelve months post-deployment, the cost per invoice stood at $9.80. Annual savings: $573,000 — against a total automation investment of $94,000.

Regional manufacturing firm · 1,800 invoices/month
hallenge: High labor cost relative to invoice volume, near-zero discount capture, no visibility into liability timing
61% cost reduction achieved
The Controller’s stated goal was not cost reduction — it was month-end close speed. She wanted to close 2 days faster. What the dashboard audit revealed was that the bottleneck driving slow close was the same bottleneck driving high cost: manual invoice coding with no ERP integration, meaning AP staff manually reconciled payables at period end.
Fixing the ERP integration didn’t just close the books faster — it eliminated 8.5 hours of reconciliation work per week per AP staff member, captured the early-pay discount window on 68% of eligible invoices (worth $94,000 annually), and reduced their cost per invoice from $18.20 to $7.10.

We’d been told for three years that automation was “too expensive for our size.” When we actually ran the numbers from our dashboard — exception rate, discount capture, cycle time — the cost of not automating was $31,000 a month. The software costs $6,200 a month. That’s not a technology decision. That’s arithmetic.
VP of Finance, Professional Services firm · 950 invoices/month · 47% cost reduction within 6 months
The three objections that delay most AP automation decisions — and the honest answers
If you’ve evaluated automation before but haven’t acted, one of these three objections is likely part of the story. Here’s what the data actually says about each one.
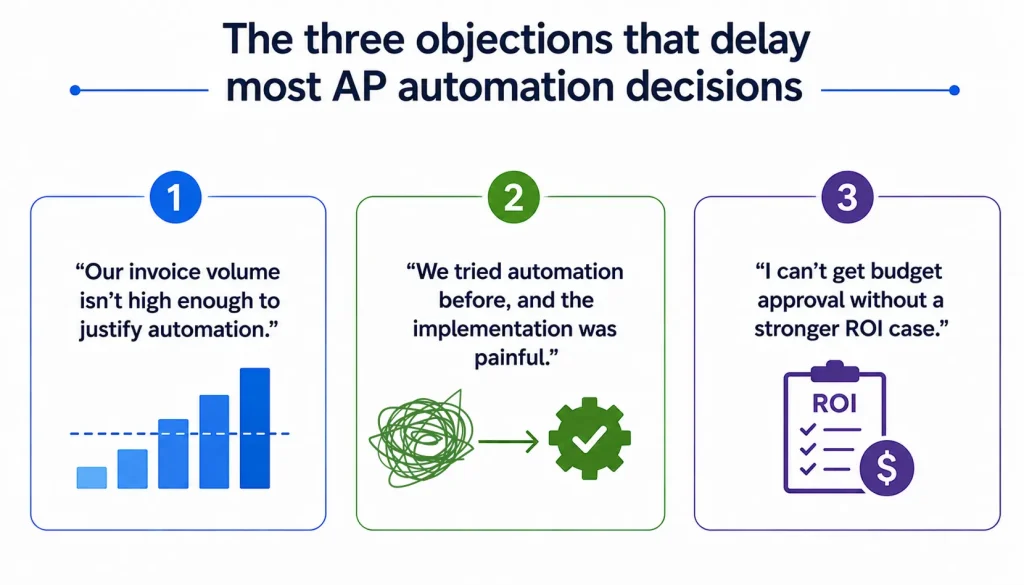
1. “Our invoice volume isn’t high enough to justify automation
This is the most expensive misconception in AP. The cost-per-invoice math works at any volume above 200 invoices per month because the largest savings categories — early-pay discount capture and exception elimination — scale with payable value, not invoice count. A 200-invoice/month company with $2M in monthly payables capturing 65% more early-pay discounts recovers more than most 2,000-invoice operations with low-value, high-volume transactions. Volume matters less than transaction value and your current exception rate.
2. “We tried automation before, and the implementation was painful
That experience is usually from implementations before 2022, when most AP tools required months of ERP configuration, supplier onboarding campaigns, and custom coding. Modern platforms deploy in 4–8 weeks via native ERP connectors, with supplier portals that onboard via email invitation. The implementation risk calculus has fundamentally changed. What made sense to avoid three years ago is no longer the same product category.
3. “I can’t get budget approval without a stronger ROI case.”
You already have the ROI case — it’s on your AP dashboard. Pull your exception rate, touchless rate, cycle time, and discount capture rate. Convert each metric gap to its dollar equivalent (the formulas are in this article). The resulting number will almost always exceed the annual software cost by 3–8x in year one alone. The CFO conversation doesn’t require a vendor’s projections. It requires your own numbers, translated into dollars.
Build your own board-ready ROI in 4 lines
This is the calculation that gets budget approved. Fill in your own numbers where shown — everything else is standard industry data.
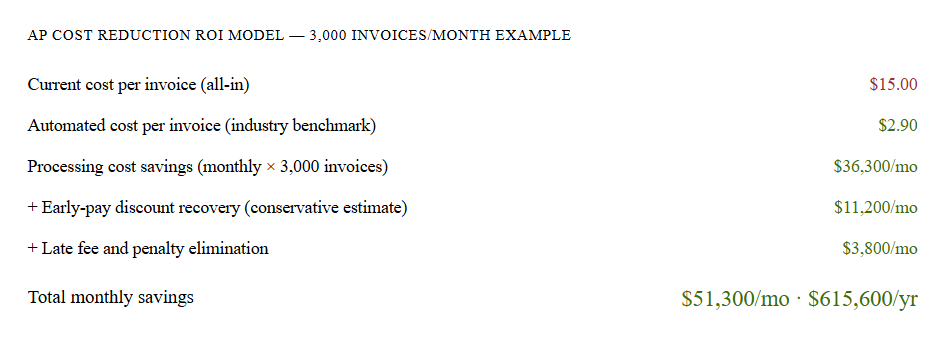
These figures use conservative industry benchmarks. Your actual all-in cost per invoice may be higher — many AP audits reveal true costs of $18–$28 once exception handling and lost discount opportunity cost are included. Run the calculation with your real numbers for an accurate figure.
What to do with this information — a 4-step action plan
If this analysis has confirmed what you already suspected, here are the four steps that convert that conviction into a decision:
1. Pull the five homepage metrics today and calculate your real cost per invoice
Cycle time, exception rate, touchless rate, discount capture, and invoices per FTE. Translate each metric gap to dollars using the formulas in this article. Document the resulting annual figure — that’s your business case number.
2. Identify your single largest cost driver — and prioritise that in any vendor evaluation
Exception rate above 18%? Your priority is AI-powered matching and supplier portal standardisation. Touchless rate below 35%? Your priority is workflow automation and approval routing. Discount capture under 25%? Your priority is cycle time reduction. Don’t let vendors lead with their feature list — lead with your number.
3. Request a vendor demo with your own data — not a canned walkthrough
Any vendor worth shortlisting should be able to show you their platform handling an invoice that matches your format, your ERP, and your exception type. If the demo uses generic sample data, ask specifically: show me a PO-mismatch exception resolved automatically.’ Show me the approval routing for my approval hierarchy. That’s where vendor claims meet reality.
4. Frame the board conversation around cost of delay — not software cost
The question your CFO needs answered is not “what does this cost?” It’s “what does not doing this cost per month?” Once you’ve run the urgency calculation, every month of procurement delay becomes a budget conversation with a specific dollar figure attached. That reframe closes most internal approval gaps.
The only number that matters
Somewhere on your AP homepage right now is a number — an exception rate, a cycle time, a touchless rate — that, if you translated it into dollars and showed it to the right person in your organisation, would end the conversation about whether to act.
The companies that reduce AP processing costs by 40–60% don’t do it because they found a better vendor or had a larger budget. They do it because someone sat down with the dashboard numbers, converted them to a dollar figure, and made the case impossible to ignore.
That person can be you. The numbers are already there.
For further details, contact us today. You can also book an AP assessment.