


Key Takeaways
- P2P automation delivers measurable working capital optimization only when it improves cash-focused metrics such as DPO, discount capture, and invoice cycle time—not just automation rates.
- The biggest financial gains come from eliminating payment delays, increasing early payment discount capture, and reducing invoice processing costs through streamlined workflows.
- High touchless processing percentages can be misleading if exception-heavy, high-value invoices still require manual intervention and delay payments.
- Organizations should fix inefficient approval workflows, disconnected systems, and exception handling before investing in automation to maximize ROI.
- A strong business case should distinguish between recurring operational savings and the one-time cash release from DPO improvements, providing a more accurate picture of long-term value.
Every finance leader has sat through a vendor demo promising “70% touchless processing” and walked away without a straight answer to the only question that matters: where does the cash actually show up? P2P automation can genuinely move working capital — but only when the implementation targets the right levers. Get it right, and you can release real cash from the balance sheet within two or three quarters. Get it wrong, and you’ve bought a faster version of the same broken process, with a six-figure invoice attached to prove it.
This piece is about working capital optimization specifically through the procure-to-pay cycle: what actually drives the cash impact, where most projects quietly underdeliver, and how to tell — before you sign anything — whether a platform will move your numbers or just your dashboards..
Where the Cash Actually Sits in Your P2P Cycle
Working capital is defined by one equation: Cash Conversion Cycle = Days Inventory Outstanding + Days Sales Outstanding − Days Payable Outstanding. P2P automation doesn’t touch inventory days or receivables days — that’s a different process, with different owners. What it touches, directly and powerfully, is the DPO and, indirectly, the cash visibility that allows treasury to actually plan around the other two.
That’s not a small lever. The Hackett Group’s 2025 U.S. Working Capital Survey, based on the 1,000 largest public companies in the country, identified a $1.7 trillion excess working capital opportunity sitting across these balance sheets — with the year’s improvement in the cash conversion cycle of roughly 4% driven almost entirely by a 3% gain in DPO. Payables discipline, in other words, is currently doing more work than receivables or inventory management for the companies pulling ahead.
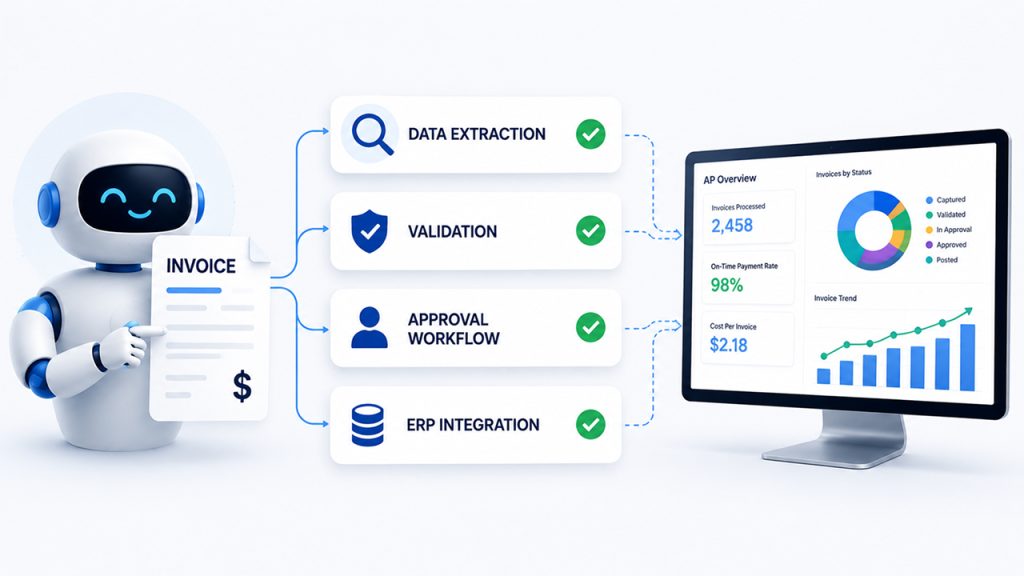
So if P2P automation is going to earn its budget line, it has to show up in DPO, in discount capture, and in the cost and speed of the process itself. Everything else — the touchless percentages, the “AI-powered matching”, and the dashboards — is a means, not the end.
The Three Levers P2P Automation Actually Pulls
1. DPO — but not the way most pitches describe it. The naive version of this story is “Automation lets you pay suppliers later, so you hold cash longer.” That’s true, but it’s the smaller and riskier half of the lever. Push DPO too aggressively and you strain supplier relationships or trigger tighter terms in response. The bigger, safer gain is removing involuntary slippage — the gap between what your payment terms say and what your chaotic, exception-ridden process actually does. Most companies aren’t paying late on purpose or early on purpose; they’re paying whenever an invoice finally clears a backlog, which is neither. A process that pays reliably on day 45 of a net-45 term every time does two things: it stops bleeding the discounts and penalties that come from inconsistency, and it gives procurement real leverage to negotiate longer terms, because suppliers trust that the payment will land exactly when promised.
2. Early payment discount capture — the lever everyone underuses. A standard 2/10 net 30 term — 2% off for paying in 10 days instead of 30 — annualizes to a return of roughly 36–37% on that cash. That’s not a rounding error; it’s one of the highest-yielding, lowest-risk uses of corporate cash available, and most companies leave it on the table. Research from the Institute of Financial Operations and Leadership puts the average discount capture rate at around 58% across AP teams generally, rising to 85–95% for teams with centralized, automated invoice workflows. The math isn’t the problem. The problem is that a 10-day discount window evaporates fast when an invoice is still sitting in an exception queue on day eight.
3. Processing cost and cycle time — the lever that funds the other two. This metric is the easiest lever to quantify and the one most vendor decks lead with, because it’s the safest stat to hand a CFO. Industry benchmarking from Stampli puts manual invoice processing at roughly $7.75 per invoice versus about $2.02 for automated processing; Ardent Partners’ research shows a similar spread, from roughly $15.00 down to $2.36, alongside cycle times of 3.1 days for best-in-class organizations versus 17.4 days for laggards. The direct savings matter, but the real value is what speed buys you elsewhere: a 3-day cycle keeps every invoice inside its discount window. A 17-day cycle guarantees that most invoices will miss their discount windows.
Where Vendor Metrics Stop Telling You the Truth
Here’s the gap nobody puts in the demo: IOFM research found that 77% of AP departments have deployed some form of invoice automation — and 68% still manually handle most of the invoices they receive. Automation adoption and automation impact are two different numbers, and the industry has gotten comfortable reporting the first one as if it implies the second.
“Touchless processing rate” and “straight-through processing” are useful internal engineering metrics. They are not working capital metrics. A platform can report a high touchless rate by routing the easy, low-value, single-line invoices through automatically while the large, multi-line, dispute-prone invoices – the ones that actually carry meaningful discount value and DPO impact – sit in exception queues, untouched by the statistic. If a vendor’s case study leads with “percentage of invoices automated” and never mentions discount capture rate, cycle time against the discount window, or DPO trend, you’re looking at a process metric dressed up as a cash metric. Ask for the second set of numbers before you ask for the first.
Four Failure Modes That Quietly Kill the Cash Benefit
Across the implementations that don’t deliver, the same four patterns show up repeatedly. Naming them makes them easier to catch during evaluation, before they become a sunk cost.
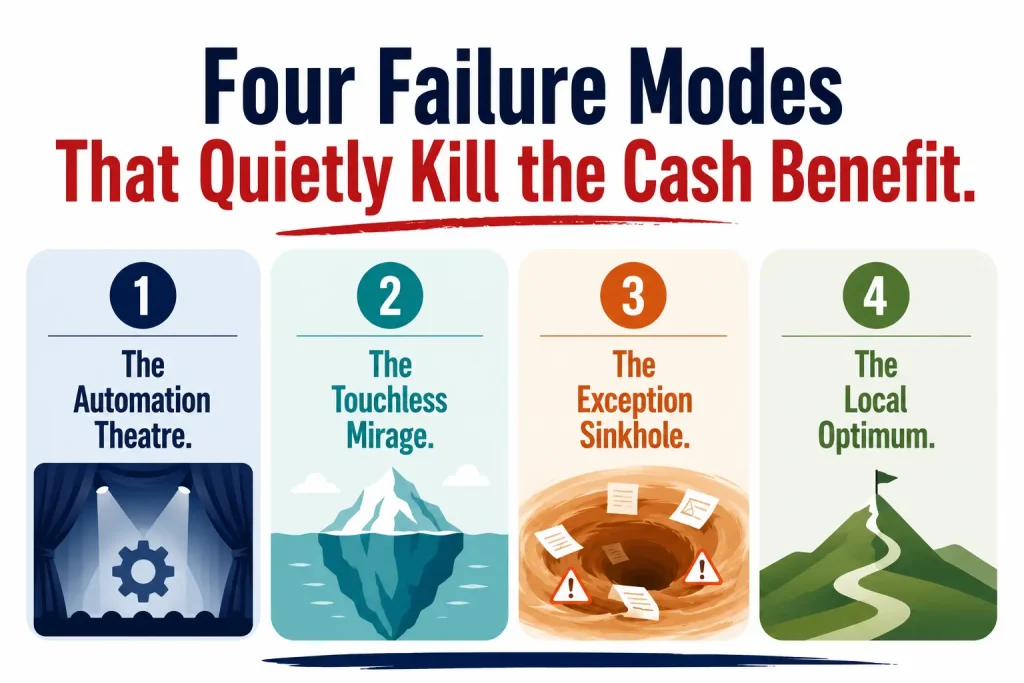
1. The Automation Theatre. This is the most common failure, and it’s structural, not technical: software layered onto an unchanged, exception-heavy approval chain. If a process currently requires five manual approvals because no one ever wrote a clear delegation policy, automation doesn’t remove four of them — it just routes the same invoice through the same five people faster. Cycle time improves slightly. Discount capture doesn’t move because the bottleneck was never speed of transit; it was the number of humans who had to say yes.
2. The Touchless Mirage. The platform reports an impressive straight-through rate, calculated only on the invoices clean enough to qualify. The 20–30% that don’t – the ones with PO mismatches, missing receipts, or pricing discrepancies – are exactly the invoices most likely to carry real dollar value and discount eligibility, and they’re the ones still sitting in a queue. The dashboard looks healthy. The cash conversion cycle doesn’t move.
3. The Exception Sinkhole. Ardent Partners’ research consistently names exception handling as the single biggest operational challenge in AP. The mechanics are unforgiving: a 2/10 net 30 invoice gives you ten calendar days, not ten business days, and not ten days from whenever someone gets around to opening it. An invoice that clears intake on day three but hits a price-mismatch exception doesn’t get a fresh ten-day clock — it has whatever’s left. By the time a clarifying email goes to the supplier and a reply comes back, the discount window has usually closed before the approval workflow even started. Average cycle times can look fine in aggregate while the exception-heavy invoices – again, often the largest ones – miss every discount they were eligible for.
4. The Local Optimum. This is the quiet, harder-to-spot failure: automation that lives entirely inside AP and never connects to procurement, purchase orders, or goods-receipt data. Three-way matching still requires a manual chase because the PO sat in one system and the goods receipt note sat in another, neither of which talked to the invoice platform in real time. The result is cheaper, faster invoice entry — a real win, just a capped one — without ever touching the DPO or discount-capture levers, because the matching bottleneck, not the data entry, was the actual constraint. The processing cost goes down. Working capital optimization, the thing that was supposed to be the point, doesn’t happen.
A Self-Diagnostic for Working Capital Optimization Readiness
Before evaluating any platform, it’s worth scoring your current process honestly. The bands below are directional, built from the research cited above rather than a universal standard, but they’re close enough to tell you where the conversation with a vendor needs to start.
| Metric | Lagging | Average | Leading |
| Cost per invoice processed | $12–$20+ | $7–$12 | $2–$5 |
| Invoice cycle time (receipt → approval-ready) | 12–17+ days | 6–11 days | 2–4 days |
| Early payment discount capture rate | Under 30% | ~50–60% | 80%+ |
| Invoice exception rate | 20%+ | 10–20% | Under 8% |
| DPO trend (trailing 12 months) | Flat or shrinking | Stable | Improving 3%+ |
| PO/goods-receipt data connected to invoice matching | No — manual chase | Partial | Real-time, integrated |
If you’re landing in the “Lagging” column on three or more rows, the honest conversation isn’t “which vendor” — it’s “fix the underlying process first.” Buying automation on top of an unstructured approval chain just gets you a faster, more expensive version of the same problem, which is exactly how the Automation Theatre failure mode starts.
The ROI Math, Worked Through
Most ROI claims in this space are asserted, not shown. Here’s the actual structure, and it’s worth separating two kinds of value that get conflated constantly: recurring P&L savings (processing cost, discount capture) and a one-time balance sheet cash release (the DPO effect). Treating both as “annual savings” is one of the more common ways finance teams overstate a P2P business case to their board.
- Processing cost avoidance (recurring): Annual invoice volume × (current cost per invoice − automated cost per invoice)
- Discount capture gain (recurring): Eligible invoice value × discount rate × (target capture rate − current capture rate)
- DPO cash release (one-time, balance sheet): DPO improvement in days × (Annual COGS ÷ 365)
A worked, illustrative example — a mid-market distributor, not a real company:
- 8,000 invoices/month (96,000/year), average value $4,200
- Current cost: $11/invoice → automated cost: $3/invoice → $768,000/year in processing cost avoidance
- 25% of invoice volume is discount-eligible at 2% terms; current capture rate 35%, target 80%
- Total eligible discount pool: 24,000 invoices × $4,200 × 2% = $2,016,000/year
- Incremental captured at +45 points: ≈ $907,000/year in additional discount capture
- Current DPO 38 days, target 47 days (+9 days), annual COGS $50M
- Daily COGS ≈ $137,000 → ≈ $1.23 million released from the balance sheet, once
Total Year 1 impact: roughly $1.68M in recurring annual benefit, plus a one-time $1.23M cash unlock. The recurring number should anchor the business case for leadership. The one-time number is what should anchor the conversation with Treasury about reduced reliance on a revolver or short-term borrowing. Conflating the two is a quick way to lose credibility with your CFO the first time someone asks where the DPO gain “went” in year two.
What This Means When You’re Comparing Platforms
Not every category of P2P tool can pull every lever above, and it’s worth being precise about which is which when you’re evaluating options:
- OCR/capture tools mostly hit level #3 — processing cost and speed for clean invoices. They rarely touch DPO or discount capture, because they don’t own the approval or payment-timing layer.
- AP automation suites with payment scheduling add lever #2 — discount capture — because they control when a payment goes out, not just how fast an invoice gets entered.
- Integrated P2P platforms spanning requisition, PO, goods receipt, invoice, and payment are the only category that can reliably move lever #1, DPO, because DPO and clean three-way matching both depend on data that lives upstream of the invoice — the PO and the receipt. A platform that can’t see that data is structurally capped at the Local Optimum described above, no matter how effective its invoice capture is.
That’s the real comparison question to bring into a vendor evaluation: not “What’s your touchless rate?” but “Which of these three levers can your system actually pull, and which ones are outside its data scope no matter how it’s configured?”
The Bottom Line
metrics—DPO trend, discount capture rate, and cycle time against the discount window—rather than internal process metrics like touchless percentage. The technology genuinely works; the $1.7 trillion sitting unrealised across the country’s largest balance sheets is not a technology gap; it’s mostly an implementation and measurement gap. Score your current process honestly, separate the recurring savings from the one-time cash release in your business case, and ask any vendor exactly which of the three levers their platform’s data scope actually allows it to pull.
If you want to work through what these three levers would be worth on your own invoice volume, payment terms, and current capture rate, that’s a conversation worth having before you shortlist anyone.