


- Dashboards alone don’t improve procurement performance. True procurement analytics combines data with automation to trigger timely actions, enabling faster, smarter, and more effective decision-making.
- Most procurement analytics initiatives fail in predictable ways. Mirror reporting, incomplete data, vanity metrics, and partially automated workflows prevent organizations from realizing the full value of their analytics investments.
- Automation transforms analytics from reporting into decision support. Continuous data reconciliation, exception-based alerts, and predictive insights help procurement teams identify risks and opportunities before they escalate.
- Assess your analytics maturity before investing in new technology. Understanding where your organization stands helps prioritize the capabilities that will deliver the greatest operational and financial impact.
- A strong ROI depends on measurable business outcomes. Time savings, improved spend visibility, working capital gains, and reduced manual effort provide a transparent framework for evaluating procurement analytics investments.
Most procurement teams don’t have a procurement analytics problem anymore. They have a dashboard problem.
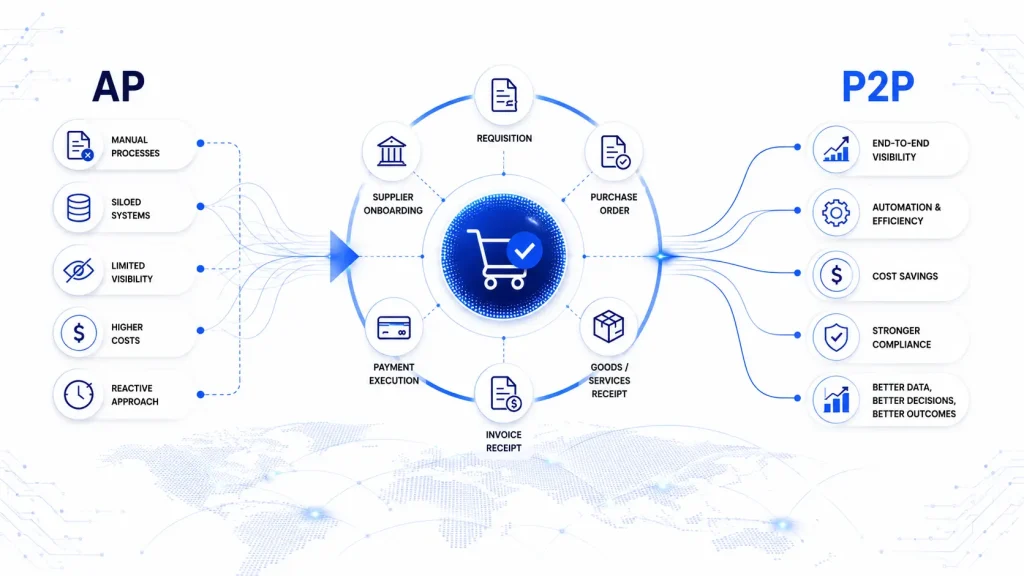
Over the last few years, nearly every procurement function has bought into the idea that data should drive decisions. Budgets followed. According to Deloitte’s 2025 Global Chief Procurement Officer Survey, data analytics now ranks as the single most prioritized area of next-generation technology investment among CPOs — ahead of invoice processing, payment automation, and even core purchasing tools. More than half of these CPOs identify siloed operations as the biggest barrier preventing their technology spending from delivering real business value.
That gap is the key issue. Organizations aren’t short on charts. They’re short on procurement analytics that actually change what happens next — the kind that only shows up when automation does the heavy lifting underneath the reporting layer.
If you’re past the “Should we invest in this?” stage and into “Which approach actually works,” this is for you. We’re going to walk through where most procurement analytics initiatives quietly fail, give you a way to diagnose your own program, and lay out an ROI model you can defend in a budget meeting — not just admire in a vendor deck.
The Procurement Analytics Mirage: Why Dashboards Aren’t Decisions
Almost every procurement platform on the market today will show you a spend-visibility percentage, a supplier scorecard, and a library of pre-built reports. These numbers feel like progress. They are also, very often, a mirage.
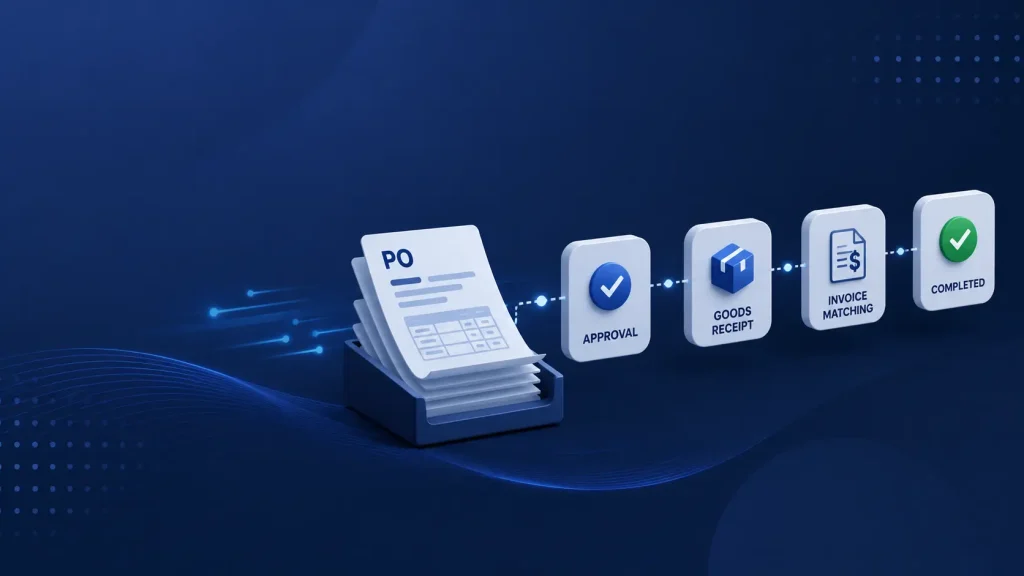
A dashboard tells you what happened. Procurement analytics with automation tells you what happened and why it happened and routes the next action to the person who needs to take it — without anyone having to go looking for it. That distinction sounds small. It isn’t. It’s the difference between a team that reviews spend quarterly and a team that catches a pricing anomaly the week it occurs.
The uncomfortable truth vendors rarely lead with: a polished UI and a “90% spend visibility” metric say nothing about whether your team’s decisions are getting faster, cheaper, or more accurate. Visibility is a precondition for analytics. It is not analytics itself. Plenty of procurement teams have excellent visibility into spend they can do nothing about, because the system that shows them the problem isn’t the one wired to act on it.
This is where automation earns its place — not as a buzzword bolted onto a BI tool, but as the connective tissue between seeing a pattern and doing something about it before a human has to notice it manually.
The Four Failure Modes of Procurement Analytics
Most “analytics doesn’t work for us” complaints trace back to one of four recurring patterns. Naming them makes them easier to catch before they quietly stall a program.
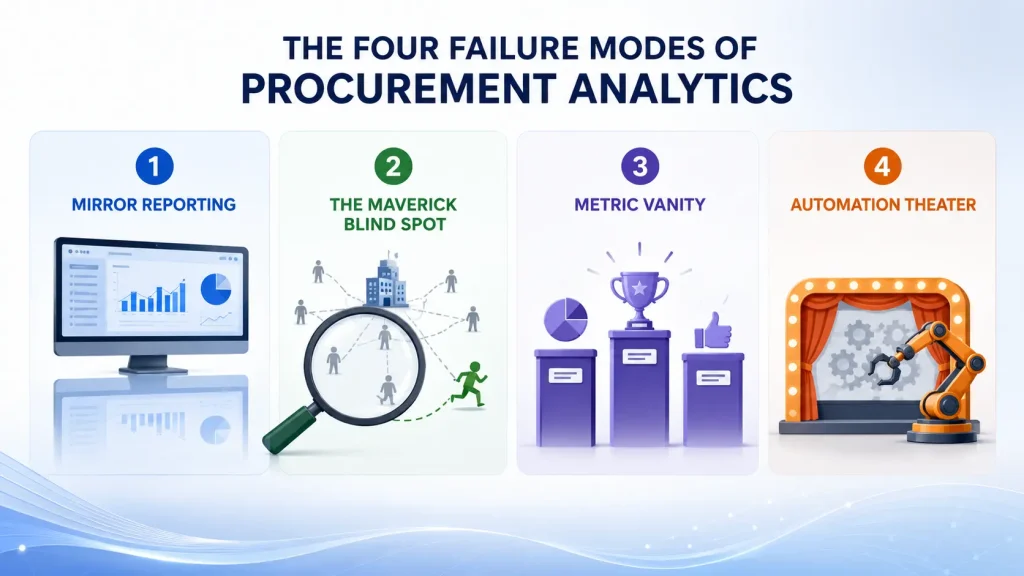
1. Mirror Reporting
The dashboard only reflects the past. It tells you that Q2 maintenance spend rose 14%, three months after Q2 ended. It is useful for a retrospective but useless for the decision that actually mattered, which needed to happen in May. Mirror reporting is comfortable because it’s accurate — it’s just accurate about the wrong tense.
2. The Maverick Blind Spot
Every procurement analytics tool is only as effective as the data that reaches it. Off-contract purchases, emergency buys, and shadow spend routed around the P2P system never make it into the model — so the analytics layer is confidently reporting on a partial picture, and nobody in the room knows which part is missing.
3. Metric Vanity
Some KPIs exist because they’re easy to track, not because they change behavior. “% of spend under management” is a classic example — it can climb steadily while negotiated savings stay flat, because the metric rewards coverage, not quality of outcome. Teams optimize the number on the slide instead of the result it was supposed to represent.
4. Automation Theater
This is the subtlest failure mode, and the one Deloitte’s data hints at directly: organizations can automate the plumbing — data extraction, report generation, and alert formatting — while the actual judgment step (should we act on this exception, and how?) still sits entirely with an overworked analyst. The workflow looks automated in the system diagram. The bottleneck just moved one step downstream, where it’s harder to see.
Procurement analytics with automation, when done well, is built specifically to close these four gaps – not just to digitize the report that used to live in a spreadsheet.
The Procurement Analytics Maturity Scorecard
Before evaluating any platform, it’s worth knowing where your program actually sits today. Score yourself honestly on each dimension, 1 (low) to 5 (high):
| Dimension | What it measures |
| Data Foundation | How complete and current is the spend, contract, and supplier data feeding your analytics? |
| Automation Depth | Are exceptions and anomalies surfaced and routed automatically or compiled manually into a report? |
| Decision Velocity | How long does it take from “the data shows a problem” to “someone acted on it”? |
| Exception Handling | When something falls outside normal parameters, does the system flag it in near real time or only at the next scheduled review? |
| Stakeholder Adoption | Do finance, category managers, and budget owners actually use the analytics to make calls, or does it mostly serve procurement’s own reporting needs? |
Add up your score:
- 5–10 — Reactive: Analytics exists mainly to answer audit and leadership questions after the fact.
- 11–15 — Operational: Reporting is reliable, but most insight still requires someone to go looking for it.
- 16–20 — Strategic: Exceptions are caught early and routed to the right owner; decisions move noticeably faster than they used to.
- 21–25 — Predictive: The system is flagging risk and opportunity before they fully materialize, and stakeholders outside procurement treat it as a primary decision input.
Most procurement teams we talk to score in the Operational range — which is exactly where the ROI of moving to automation-driven analytics is largest, as the data foundation already exists. The gap lies entirely in what happens to the data after collection.
What Changes When Automation Actually Powers the Analytics
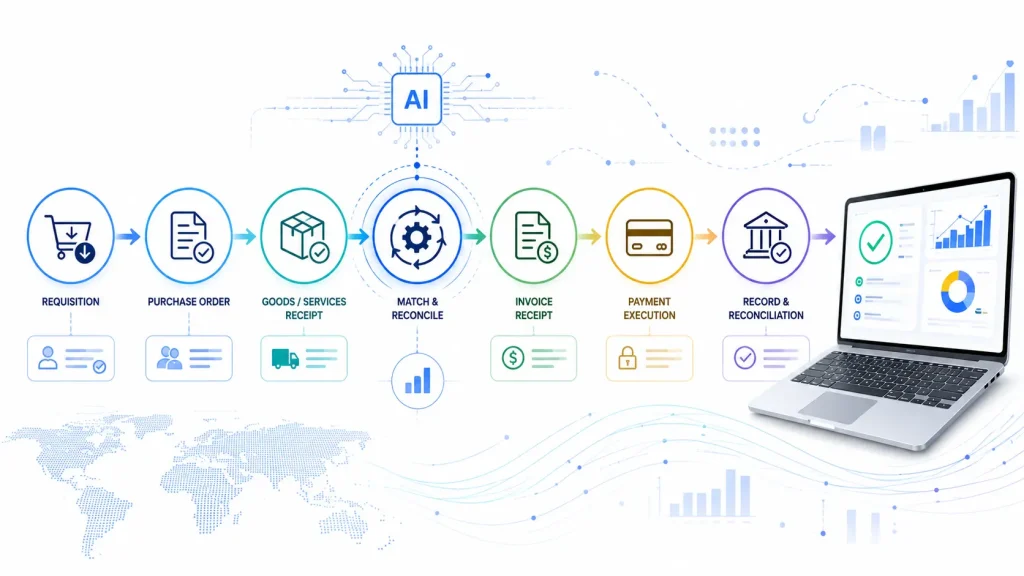
Three mechanical shifts separate a reporting tool from a genuine procurement analytics-with-automation setup:
1. Continuous reconciliation instead of batch refreshes. Spend, invoice, and contract data reconcile against each other constantly, not on a nightly or weekly basis — so a price discrepancy or a missed discount surfaces in hours, not at month-end close.
2. Exception-based alerting instead of scheduled reports. Rather than a 40-page report someone skims for anomalies, the system pushes a notification only when something falls outside a defined threshold — a supplier price drifting from contracted rates, a category trending toward budget overruns, or a payment term that quietly slipped.
3. Forward-looking signals instead of historical summaries. Predictive spend forecasting and supplier risk scoring update as new data arrives, rather than waiting for a quarterly model refresh – turning the system from a record keeper into an early warning layer.
This is also, candidly, where the return on investment compounds. Deloitte’s research distinguishes procurement organisations it calls “Digital Masters” — those combining real technology depth with the talent to use it — from the rest of the field. Digital Masters reported GenAI returns roughly double those of their slower-moving peers, and they consistently outperform on cost savings, supplier performance, and stakeholder satisfaction. The differentiator wasn’t just having analytics. The key was having analytics wired into automated decision routing, with people trained to act on the insights it surfaced.
A Transparent ROI Framework for Procurement Analytics
Most ROI pitches for analytics platforms are built backward from a number marketing wants you to see. Here’s a version you can actually defend to a CFO, because every input is something you can measure inside your own organization:
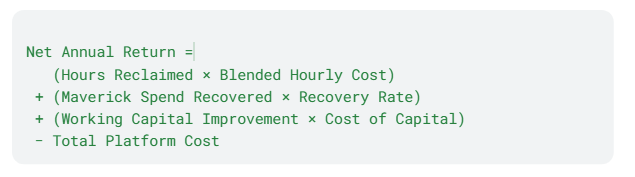
Worked example (illustrative numbers — replace with your own):
- A category management team of 6 spends roughly 10 hours/week on manual report compilation and exception-chasing. Automating that reclaims ~3,000 hours/year. At a blended, fully-loaded cost of $55/hour, that’s $165,000.
- Maverick spend visibility improves from 70% to 92% of total spend. On $40M in addressable spend, this surfaces roughly $8.8M in previously invisible transactions. Even a conservative 3% recovery/renegotiation rate on that newly visible spend is $264,000.
- Faster invoice and contract data reconciliation shortens days payable outstanding by 4 days on $25M in annual payable spend, freeing up working capital. At a 7% cost of capital, that’s roughly $19,200 in annualized value.
- Subtract platform and implementation cost — say $140,000 for the year.
Net Annual Return ≈ $308,200
Your numbers will look different. The point of the framework isn’t the example — it’s that every line item links back to something you can pull from your own systems before you sign anything, instead of relying on a vendor’s ROI calculator
Questions to Ask Before You Commit
When you’re comparing procurement analytics platforms, the marketing language tends to converge. These questions tend not to:
- What’s the actual data latency? “Real-time” means different things to different vendors — ask for the specific refresh cycle on spend, invoice, and contract data separately.
- Where does automation stop and manual review start? Ask them to walk through one exception end-to-end, from detection to resolution, and identify exactly which steps still require a human to open a separate tool.
- How does it handle data it wasn’t expecting? Off-contract spend, new suppliers, miscoded categories — this is where the Maverick Blind Spot either gets solved or quietly persists.
- What does adoption outside procurement actually look like for existing customers? A tool only finance and category managers actually use is a very different proposition than one collecting dust after the pilot.
- Can they show you the failure modes they’ve seen in implementations like yours? A vendor with real depth will have a specific, named answer. A vendor selling a dashboard will pivot back to features.
Where This Leaves You
Procurement analytics with automation isn’t a feature you switch on. It’s the difference between a system that tells you what happened and one that routes the next decision to the right person before you ask. The teams pulling ahead right now aren’t the ones with the prettiest dashboards — they’re the ones who closed the gap between seeing a problem and acting on it.
Run the maturity scorecard above honestly. If you’re landing in Reactive or Operational territory, that’s not a verdict — it’s a starting point and usually the fastest one to move from. If you want to talk through where the biggest lever is for your specific spend profile, that’s precisely the kind of conversation worth having before you sit through another demo.