


Key Takeaways
- Procurement cycle time should be measured by purchase category and spend tier rather than relying on a single average metric.
- Most procurement delays stem from a few recurring bottlenecks, including approval workflows, vendor onboarding, reconciliation, and resource constraints.
- A structured self-assessment helps organizations identify the biggest process gaps before investing in new procurement technology.
- ROI should be calculated using measurable business outcomes such as labor savings, working capital improvements, and reduced maverick spend.
- The most effective procurement solutions address specific operational bottlenecks while balancing automation, compliance, and long-term scalability.
If you’re reading this, you’ve probably moved past the “cycle time matters” stage. Your team already knows that. What’s harder is knowing exactly where the days are going and whether the fix is a process change, a policy change, or a system change. At its core, procurement efficiency is about eliminating unnecessary delays while maintaining compliance and control throughout the purchasing process.
That distinction matters more than most vendor content admits. “Reduce procurement cycle time” gets pitched as a single problem with a single fix, usually whichever tool is being sold. In practice, cycle time is a lagging indicator made up of several distinct, separately diagnosable leaks. Treat it as one problem and you’ll buy a tool that fixes 20% of your delay and leaves the rest untouched.
This piece is structured to help you diagnose before you buy: a taxonomy of where cycle time actually breaks down, a rubric to score your organization against it, and an ROI framework that doesn’t rely on inflated industry averages.
Why “Average Cycle Time” Is Lying to You
Most procurement dashboards report a single number: average days from requisition to PO issuance, or requisition to receipt. That number is almost always misleading, for three reasons.
- It blends incomparable purchase types. A $300 office-supplies reorder and a $400,000 capital equipment purchase shouldn’t be in the same average — they have entirely different approval paths, risk reviews, and stakeholder counts. Averaging them produces a number that describes neither.
- It hides the tail. A median cycle time of 4 days sounds healthy. If 15% of your POs take 25+ days, that tail is where your maverick spend, expedited shipping costs, and frustrated requesters are coming from — and the average won’t show you that.
- It conflates “slow” with “stuck”. A purchase that moves steadily through six necessary review steps over five days is not the same problem as a purchase that sits untouched in one approver’s inbox for five days. Both produce identical cycle-time numbers. Only one is a process failure.
If your current measurement approach is a single blended average, the first efficiency gain available to you is free: segment by purchase category and spend tier before you change anything else. You’ll often find that 80% of your cycle-time problem is concentrated in 20% of your purchase types – which tells you exactly where to focus the rest of this framework.
The Five Leaks: A Failure-Mode Taxonomy
Once you segment, distinct patterns tend to emerge. Here are the five most common ones, each with a different root cause and a different fix. These five failure modes are the most common barriers to procurement efficiency. Identifying which one affects your organization first is the key to reducing procurement cycle time.
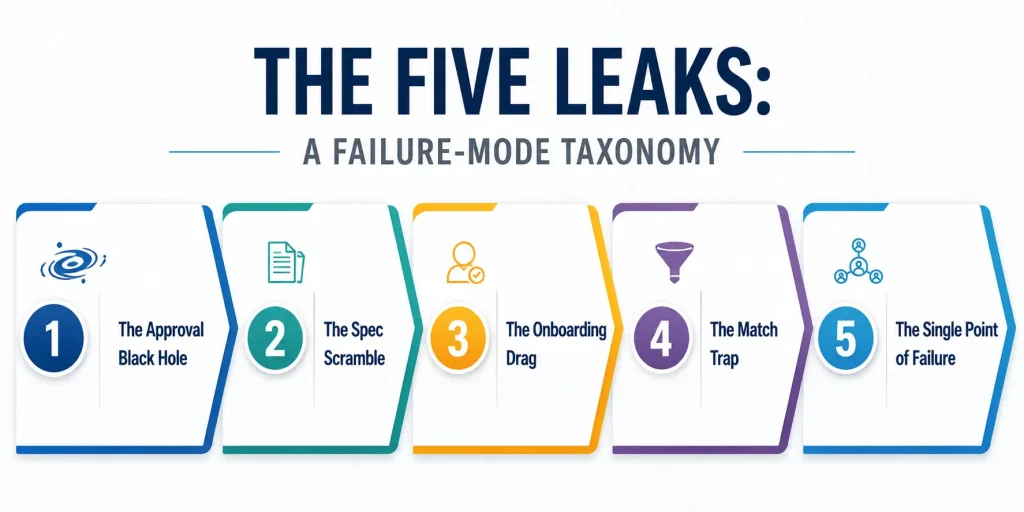
1. The Approval Black Hole
A requisition is technically ‘in review’, but no one is actively reviewing it. This phenomenon shows up as long dwell time at a single approval step, usually because approval thresholds route too many low-risk purchases to senior staff who treat procurement approvals as low-priority inbox noise. The fix is almost never “more reminders” — it’s re-tiering approval thresholds so only genuinely risky purchases reach senior approvers.
2. The Spec Scramble
The requisition is incomplete or ambiguous, and the cycle time is really rework time: back-and-forth between requester and buyer to clarify quantity, specification, or budget code. This leak is invisible in cycle-time dashboards because the clock doesn’t stop during clarification loops — it just keeps running. The tell is a high ratio of comments/edits per requisition relative to your “fast” purchase categories.
3. The Onboarding Drag
The purchase itself could move fast, but the vendor is new and hasn’t completed setup – tax documentation, banking details, compliance review, and insurance certificates – yet. This fee is a one-time tax that gets misattributed to “procurement is slow” when it’s actually “vendor master data setup is slow”. Tracking time-to-first-PO separately from vendor-onboarding time usually reveals this is a much bigger driver of perceived slowness than people assume.
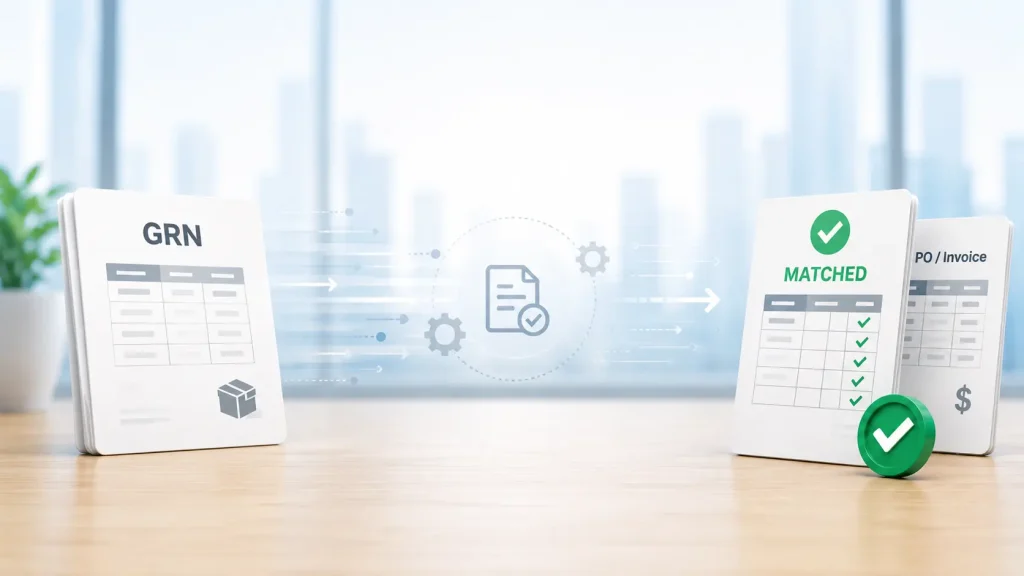
4. The Match Trap
The match trap is the one that surfaces after the PO is issued: the purchase order, the goods receipt, and the invoice don’t agree, and the mismatch sits in a queue until someone manually reconciles it. Three-way matching is supposed to be a control, not a bottleneck – but in manual environments, it routinely adds more elapsed time than the entire upstream requisition-to-PO process combined. If your cycle-time metric stops at “PO issued”, you’re not measuring the leak that’s actually costing you the most.
5. The Single Point of Failure
One buyer, or one small team, handles a disproportionate share of requisitions—often the most complex or highest-value ones—because that’s where institutional knowledge lives. Cycle time looks fine in aggregate until that person is out, at which point it spikes. This leak is structural, not procedural, and no software purchase fixes it on its own; it requires deliberate cross-training and workload redistribution alongside any tooling change.
Most organizations have at least two of these active simultaneously, which is why generic “automate your procurement” pitches underdeliver — automation that targets the Approval Black Hole does nothing for the Match Trap.
Self-Diagnostic Rubric
Score your organization 1–5 on each leak below before evaluating any solution. Be specific to your highest-volume purchase category, not your best-case example. Assessing these process gaps provides a practical way to measure and improve procurement efficiency before investing in new technology.
| Leak | Score 1 (Severe) | Score 3 (Moderate) | Score 5 (Minimal) |
| Approval routing | Most approvals route through 1–2 senior staff regardless of risk | Tiered thresholds exist but aren’t consistently followed | Risk-based routing is enforced and audited |
| Requisition clarity | Frequent rework loops; requesters routinely resubmit | Occasional clarification needed, mostly for new requesters | Standardized templates eliminate most ambiguity |
| Vendor readiness | New-vendor onboarding regularly adds 1+ weeks | Onboarding is tracked but inconsistent | Pre-qualified vendor pool covers most spend |
| Match/reconciliation | Manual 3-way matching with a visible backlog | Matching is automated for some categories | Matching is automated and exceptions are rare |
| Buyer capacity | One person/team is a known bottleneck during absences | Some cross-training exists | Workload is distributed; no single point of failure |
Total score 5–12: You likely have compounding leaks. Don’t start with a tool purchase — start with the segmentation exercise above to confirm which leak is largest. Total score 13–19: You have one or two specific leaks worth targeting directly; a point solution may be sufficient. Total score 20–25: Your bottleneck is probably not process — it may be capacity, headcount, or a genuinely complex approval requirement that’s appropriately cautious. Don’t force an efficiency fix onto a control that’s working as intended.
A Transparent ROI Framework
Most vendor ROI claims skip the math entirely and just assert a percentage. Here’s the actual structure, so you can run your numbers rather than trust someone else’s case study.
Annual value of cycle-time reduction ≈ (Days reduced per PO × POs per year × daily carrying/working-capital cost per PO) + (Buyer hours saved per PO × PO volume × fully loaded hourly labor cost) + (Reduction in maverick/off-contract spend × average savings leakage rate) − (Cost of the solution, including implementation and change management)
Illustrative example (hypothetical figures, for structure only):
- 5,000 indirect POs per year
- Average cycle time reduced from 9 days to 5 days (4-day reduction)
- Estimated working-capital/carrying impact: $8/day per PO at scale
- Buyer time saved: 20 minutes per PO, loaded cost $45/hour
- Maverick spend reduction: 3% of $12M addressable spend, at an estimated 8% savings leakage
That works out to roughly $160,000 in working-capital impact, $75,000 in labor time recovered, and $28,800 in reduced leakage — before subtracting implementation cost. The exact multipliers will differ for your organization; the point of showing the formula is that you should be able to plug in your numbers and get a defensible figure, not a marketing one.
Notice what’s not in this formula: a generic “% faster” claim with no underlying mechanism. If a vendor case study can’t show you which of these four levers their numbers came from, ask before you trust the figure.
What to Look for When You Start Evaluating Solutions
Given the five leaks above, here’s what’s actually worth screening for in a vendor demo – independent of which specific platform you’re considering:
- Risk-based approval routing, not just sequential approval chains — can thresholds be configured by category and spend tier, not just dollar amount?
- Native three-way matching with exception handling, since this is where elapsed time often hides — ask specifically how mismatches are surfaced and resolved, not just whether matching exists.
- Vendor self-service onboarding, so vendor-readiness delays don’t fall on your team.
- Audit trail and reporting granularity allow you to segment cycle time by category; if the tool only provides a blended average, you will encounter the same measurement problem that this article initially discussed.
- Realistic implementation timeline and change-management support — the Single Point of Failure leak isn’t solved by software alone, so ask how the vendor supports cross-training and adoption, not just configuration.
Where This Leaves You
Procurement efficiency isn’t a single lever; it’s the sum of your leaks, their size, and whether the fix is process, people, or platform. The rubric above should take less than thirty minutes to run honestly across your highest-volume category. Do that before your next vendor conversation, and you’ll be evaluating solutions against your actual bottleneck instead of a generic pitch deck.
If you’re at the stage of comparing procurement automation platforms directly, a structured comparison — scored against the same five leads — is a useful next step before committing to a demo cycle.