


Key Takeaways
- Spend visibility is not achieved by dashboards alone; it depends on trusted, accurate, and actionable data.
- Most spend analytics initiatives fail because of implementation issues such as poor data governance, weak categorization strategies, and limited stakeholder adoption.
- Tail spend, expense data, and P-card transactions must be included to create a complete picture of organizational spending.
- Continuous maintenance of taxonomies, supplier data, and AI classification models is essential to sustain long-term accuracy and user trust.
- The greatest value of spend analytics comes when procurement, finance, and business units use a single source of truth to drive real purchasing and budgeting decisions.
Every procurement leader wants spend visibility. Most organizations have tried to build it. Yet the gap between a working spend analytics system and an expensive data aggregation exercise is wider than vendors admit — and the difference lies not in the technology but in four specific decisions made during implementation.
Talk to any CPO who has been in their role for more than two years, and you will hear a version of the same story: “We bought a spend analytics platform. The first board presentation looked impressive. Eighteen months later, the team stopped using it.”
The technology rarely failed. What failed was the assumption that connecting data sources and building dashboards was the same as building visibility. It is not. Visibility is the state in which decision-makers trust the data enough to act on it. Dashboards that procurement teams don’t trust — because categorization is wrong, because supplier names are duplicated, or because the numbers don’t match the ERP — aren’t visibility. They’re a liability.
This distinction matters enormously when you’re evaluating your next move. The question is not “should we automate spend analytics?” — the answer to that is almost certainly yes. The question is “what does it take to do it in a way that actually sticks?” That is what this article addresses.
The real benchmark to track: Don’t measure spend analytics success by dashboard adoption or data coverage. Measure it by the number of procurement decisions in a quarter that were directly informed by spend data – renegotiations triggered, consolidation actions taken, and budget overruns caught before month-end. That number, not report usage, tells you whether your investment is working.
Where does your organization sit today? The spend visibility maturity model
Before evaluating solutions, it is worth an honest placement of where you are. The five stages below are not vendor-defined aspirations — they reflect the operational reality we see across procurement functions at different scales.
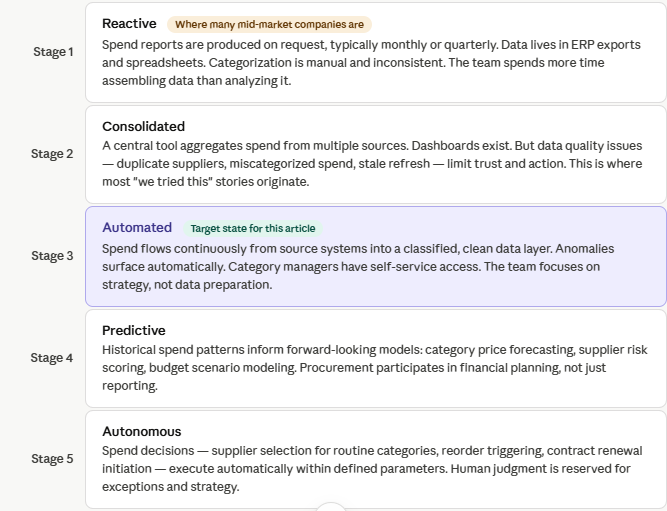
The gap between Stage 2 and Stage 3 is where most organizations stall. The technology exists to bridge it. The obstacle is almost always one of four implementation mistakes, each of which is both common and preventable.
Four implementation mistakes that turn spend analytics into a shelf product
These are the failure patterns we see most consistently — not in theory, but in the post-mortems of spend analytics projects that didn’t deliver.
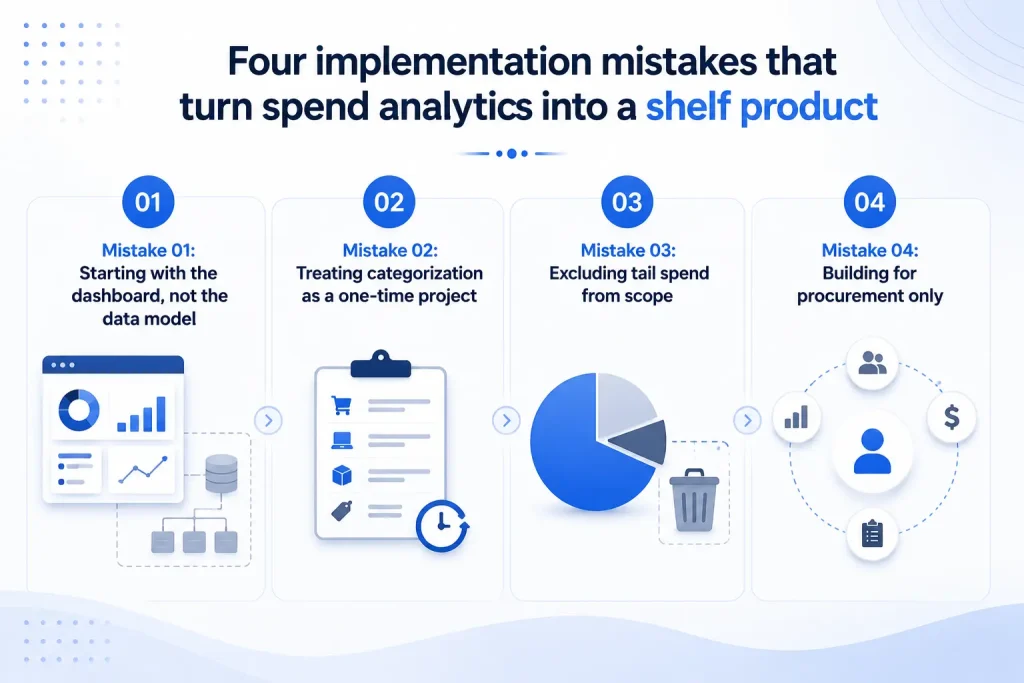
Mistake 01: Starting with the dashboard, not the data model
underlying category taxonomy, supplier master, and data refresh architecture. The result is a beautiful dashboard built on shifting sand — numbers that look authoritative but can’t withstand scrutiny.
Fix: Define your category taxonomy and supplier hierarchy first. The taxonomy is your contract with the business about what ‘spend’ means — get that wrong and every downstream analysis is wrong too.
Mistake 02: Treating categorization as a one-time project
Organizations invest significant effort in an initial classification exercise, then let the model drift. New suppliers, new cost centers, acquisitions, and changed purchasing patterns gradually erode accuracy. Within 12 months, a 90% accuracy rate has often fallen to 70% – enough to undermine trust in the entire system.
Fix: Build ongoing model retraining into the operating model from day one, not as a future phase. Budget for it.
Mistake 03: Excluding tail spend from scope
Implementation teams often scope out low-value transactions to manage complexity. This is logical for project delivery but creates a persistent blind spot: tail spend in most organizations represents 20–35% of total spend value and nearly 80% of transaction volume. Excluding it means your “complete” spending picture is structurally incomplete.
Fix: Include tail spend in scope from the start, even at lower classification granularity. An approximate picture of all spend is better than a precise picture of some spend.
Mistake 04: Building for procurement only
When spend analytics is positioned as a procurement tool, finance and operations leaders never adopt it. This creates a political problem: procurement cites data that finance doesn’t trust and that business unit heads haven’t seen. In the same meeting, different versions of the truth lead to decisions.
Fix: Design the access model for cross-functional use from the start. Finance, category managers, and BU heads should each have a view built for their questions – not just read-only access to the procurement dashboard.
What good actually looks like: industry-specific proof points
Generic benchmarks — “organizations save 8–12% through spend visibility” — are useful for building a business case but insufficient for evaluation. What matters is whether the outcomes are plausible for your industry, your spend profile, and your organizational context. The scenarios below reflect the specific value patterns that emerge in different sectors.
1. Manufacturing & industrial
A mid-sized industrial manufacturer with operations across three countries had 14 ERP instances following a series of acquisitions. Spend reporting required a four-person finance team to spend approximately 60% of their time on data extraction and reconciliation. Category-level visibility lagged 6–8 weeks behind actual spend.
After implementing automated spend analytics with direct ERP connectors and AI-driven categorization, the immediate impact was not savings — it was the discovery of 47 overlapping MRO supplier relationships across sites that procurement had no visibility into. The consolidation of those relationships, negotiated from a position of credible volume data for the first time, reduced indirect materials cost by 14% within two contract cycles.
What made the difference: The value wasn’t in the platform’s dashboards—it was in having accurate, consolidated supplier spend data that made a renegotiation credible to suppliers who had previously been able to play regional teams against each other.
2. Retail & consumer goods
A specialty retailer found that 23% of its marketing and agency spend was flowing through personal credit cards and expense reports rather than purchase orders — invisible to procurement, untracked against contracts, and effectively unmanaged. The discovery happened not through an audit but through a spend analytics implementation that, for the first time, connected P-card and expense data to the same category taxonomy as PO-based spend.
The response wasn’t to restrict card spending – it was to create preferred vendor catalogs and punch-out capabilities for the categories most commonly purchased off-contract, reducing maverick spend by 31% over 18 months while improving compliance without adding approval friction.
The insight that matters for evaluation: If your current spend analytics implementation doesn’t include expense and P-card data at the same classification depth as PO data, you are systematically blind to a significant share of your spend — and the gap is almost certainly larger than you think.
The five pillars and what actually breaks each one
Most descriptions of spend analytics automation list capabilities in ways that sound comprehensive. What they rarely include is the specific failure mode for each capability — the thing that causes it to stop delivering value in practice. That is what this section addresses.
01 Unified data ingestion
Automated connectors pull transactions from ERP, P-cards, expense tools, and supplier invoices into a single classified data layer. The architecture matters as much as the coverage.
What breaks it: Relying on scheduled batch exports rather than event-driven or API-based integration. A nightly batch process that fails silently — no alert, no data gap indicator — is worse than no automation because it creates false confidence in data completeness
02 AI-driven spend categorization
L models classify transactions at ingestion against your taxonomy. Accuracy of 90–95% is achievable — but only with sufficient training data and active model governance.
What breaks it: Treating classification accuracy as a deployment metric rather than an ongoing operational metric. Ask any vendor for their median classification accuracy at 12 months post-deployment, not just at go-live; the gap between those two numbers tells you everything about their model governance approach.
03 Supplier master data management
Automated entity resolution identifies duplicate supplier records and consolidates spend under canonical supplier entities — making consolidated volume visible for negotiation.
What breaks it: Entity resolution works well on exact-match duplicates but fails on fuzzy cases, such as different legal entities for the same parent company, subsidiary relationships, and DBA names. The duplicates that cause the most procurement damage are the ones that require business context to resolve, not just string matching.
04 Continuous monitoring and alerting
Rule-based and anomaly-detection alerts surface spend deviations – policy violations, budget overruns, and duplicate payments – as they happen rather than in retrospective reports.
What breaks it: Alert fatigue. Systems tuned to catch everything generate so many notifications that finance teams start ignoring them within weeks. Effective alerting requires intelligent noise filtering — the ability to distinguish a genuine anomaly from routine variance. This is a product design problem, not just a threshold configuration problem.
05 Self-service analytics
Business users — category managers, finance BPs, and cost center owners — can answer their own spend questions without IT or data analyst involvement.
What breaks it: Self-service tools that are powerful enough for data analysts but too complex for business users. The test is not whether a power user can build any analysis — it’s whether a category manager who uses the tool once a week can answer a new question independently. If the answer is “They’d need to ask the data team,” the self-service goal has not been met.
Spend analytics automation is not a technology purchase. It is an organizational capability that a technology enables. The organizations that get the most from it are not those that bought the best product — they are those that were most honest about their data quality, most disciplined about their taxonomy, and most deliberate about ensuring the insights connected to actual decisions. The technology is the easier part.
Ready to go beyond the vendor pitch? Whether you’re evaluating your first spend analytics platform or trying to understand why your current one isn’t delivering, at Auxiliobits, we can help you run a spend data diagnostic, build a category-level business case, or pressure-test a vendor shortlist.