


You already know something is wrong. Invoices are stacking up, approvals are getting chased over email, and your month-end close feels more like firefighting than finance. What you may not yet know is where the process is breaking down — and why that distinction is so important for fixing it.
Identifying the specific bottlenecks in your accounts payable process isn’t just a diagnostic exercise. It’s the foundation of any meaningful AP process improvement initiative. Without pinpointing where delays, errors, and inefficiencies actually live, even well-intentioned automation projects get deployed in the wrong places — and the same problems resurface six months later.
This guide walks you through a structured method to map, measure, and locate bottlenecks in your AP workflow, so your next improvement effort hits the right targets.
Why “we’re slow at AP” isn’t specific enough
The phrase “AP bottleneck” is often used interchangeably with “AP is slow”. But slowness is a symptom, not a diagnosis. The actual constraint could be sitting in any one of several distinct stages — each with a very different root cause and a very different fix.
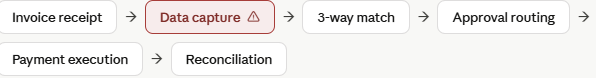
Example: Data capture is highlighted as the bottleneck stage. In your process, it could be anywhere.
A team manually keying invoice data into an ERP has a data capture problem. A team whose invoices sit unresolved for weeks has an approval routing problem. A team constantly managing duplicate payments has a matching or exception-handling problem. The fix for each is categorically different.
“The most common mistake in AP improvement projects is automating a broken process. You just make things worse, faster, and at scale.
The 7 most common AP bottlenecks — and how to spot them
These are the areas where AP processes most frequently break down. For each one, we’ve included the key symptoms to look for during your internal review.
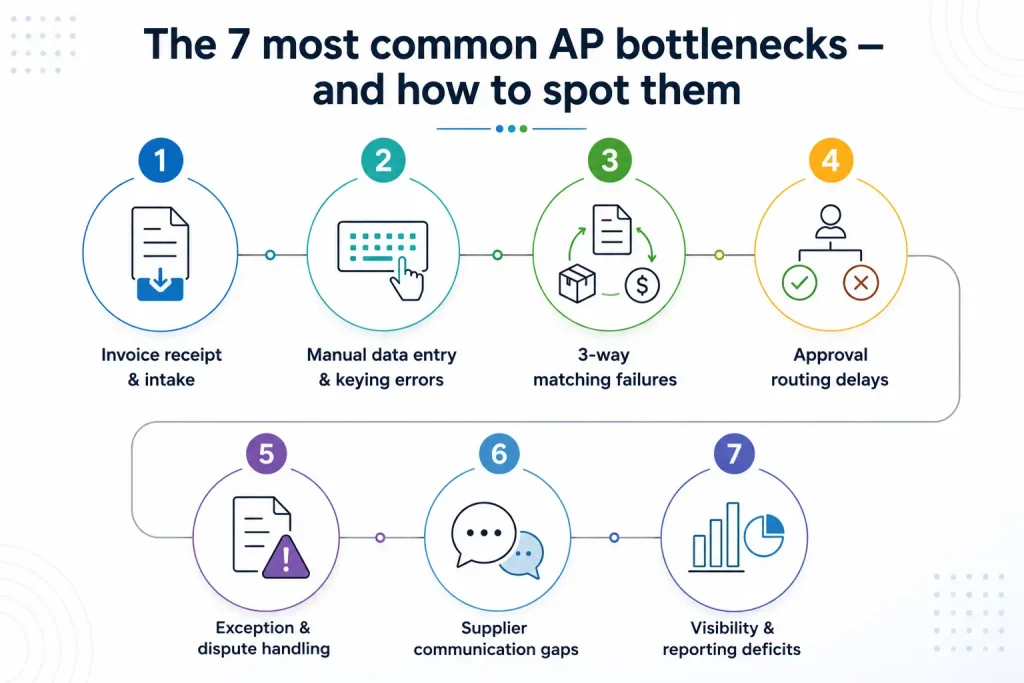
1. Invoice receipt & intake
Invoices arrive via multiple channels — email, post, portal, fax — but there is no centralised capture point. Some invoices are missed entirely.
2. Manual data entry & keying errors
Staff manually transcribe invoice fields into the ERP. Each entry is a potential error and a time sink — often the single biggest processing cost driver.
3. 3-way matching failures
Invoice, PO, and goods receipt data don’t align. Even small discrepancies create exceptions that need manual resolution — holding up entire payment batches.
4. Approval routing delays
Invoices sit in inboxes waiting for approvers who are travelling, unavailable, or simply unaware. No escalation path. No visibility on what’s pending and why.
5. Exception & dispute handling
Non-PO invoices, disputed amounts, and price variances pile up in a shared inbox with no structured workflow. The same issues recur without root cause resolution.
6. Supplier communication gaps
Suppliers chasing payment status are handled ad hoc. No self-service portal means AP staff spend significant time on inbound status calls instead of processing.
7. Visibility & reporting deficits
Management has no real-time view of invoice status, aging payables, or DPO trends. Decisions are made on stale spreadsheet data or not made at all.
Step 1: Map your current AP workflow as-is
Before you can identify where bottlenecks exist, you need an accurate picture of how your process actually runs — not how the procedure manual says it should run. These two are often significantly different.
Conduct brief structured interviews with the people doing the work: AP clerks, team leads, and anyone in the approval chain. Ask them to walk you through their step-by-step process for a typical invoice, including workarounds, waiting, and exceptions.
Questions to ask in your process mapping sessions
- Where do you first see an invoice, and in what format does it typically arrive?
- What do you do when information is missing or unclear on an invoice?
- How do you know an approval has happened — and what happens when it hasn’t?
- What are the top three things that cause invoices to get stuck or delayed?
- Which part of this process do you think wastes the most time?
- When was the last time you had to pay a late payment fee? What caused it?
Document the output as a process map, even a basic swim-lane diagram. The goal isn’t a polished presentation — it’s making the invisible visible so you can reason about it systematically.
Step 2: Measure cycle time at each stage
Once you have a process map, overlay it with timing data. Time-to-completion at each stage is your primary signal for where constraints are hiding.
Pull data from your ERP or invoice management system to calculate the average and maximum time spent at each stage. If your system doesn’t capture this granularity, you can infer it from invoice timestamps: date received, date entered, date approved, and date paid.
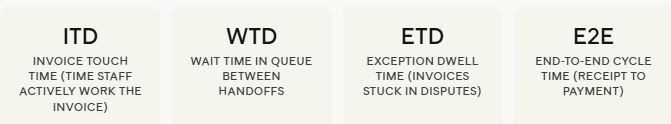
In most AP operations, the largest share of end-to-end cycle time is wait time — not touch time. That’s an important insight, because it means the bottleneck often isn’t about how fast your team works but about handoffs, approvals, and queues that are structurally broken.
Watch for this pattern: If your average cycle time is 12 days but your touch time is only 40 minutes per invoice, you have a queue and approval problem — not a staffing or productivity problem. Hiring more AP staff won’t fix it.
Step 3: Analyse your exception and error rate
Exceptions – invoices that can’t be processed straight through and require manual intervention – are one of the most reliable indicators of underlying bottlenecks. A high exception rate tells you the process is structurally fragile.
Categorise your exceptions over the past three months. You’re searching for patterns, not individual incidents.
Exception categories to track
- Missing PO number — invoice arrived without a valid PO reference
- Price variance — invoice amount differs from PO by more than tolerance
- Quantity mismatch — goods receipt quantity doesn’t match invoice quantity
- Duplicate invoice — same invoice submitted more than once
- Missing or incorrect tax information
- Unrecognised vendor — invoice from a supplier not in the approved vendor master
- Approval not received within SLA threshold
If 20% of your invoices are exceptions, that’s a systemic problem. If 80% of your exceptions are one type — say, missing PO numbers — that’s a procurement process problem, not an AP one. The categorisation tells you not just where the bottleneck is, but whose problem it is to fix.
Step 4: Benchmark your performance against industry norms
Raw metrics only mean something in context. Comparing your AP performance against peer benchmarks helps you understand whether you’re dealing with a significant gap or marginal inefficiency – and helps prioritise where to focus improvement effort first.
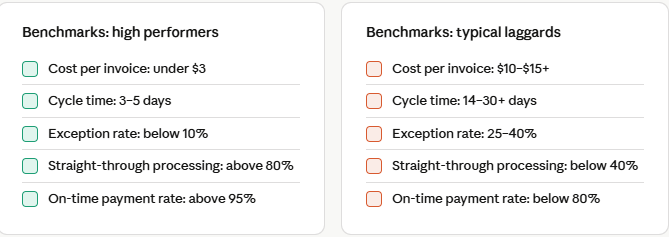
If your metrics cluster in the laggard range, the opportunity for AP process improvement is substantial — and the business case for investment almost writes itself. If you’re in the middle, the question is which specific constraints, when removed, would have the biggest impact.
Step 5: Use the 5 Whys to trace root causes
Once you’ve identified where time is being lost and exceptions are clustering, you need to understand why — not at the surface level, but at the structural level. The 5 Whys technique, borrowed from lean manufacturing, works well here.
Take your highest-impact bottleneck and ask why it happens. Then ask why that is true. Then ask again. Do it five times (or until you reach an answer you can actually act on).
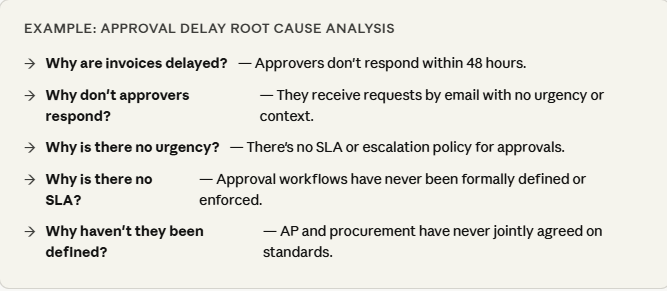
In this example, the real issue isn’t approver responsiveness — it’s the absence of a jointly owned approval policy. The fix is cross-functional, not technical. You wouldn’t solve this by reminding approvers more often; you’d solve it by establishing SLAs and building an escalation path.
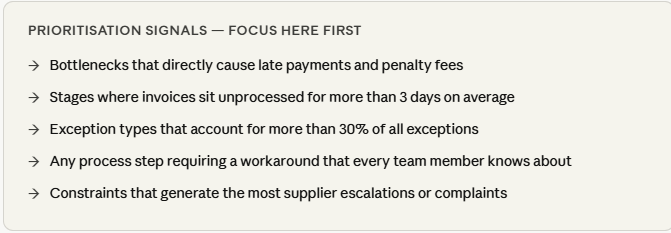
Step 6: Build your bottleneck-priority matrix
all bottlenecks are worth fixing with the same urgency. Some have high frequency but low impact; others are rare but catastrophic when they occur. A simple priority matrix helps you sequence your AP process improvement initiatives rationally.
For each identified bottleneck, score it on two dimensions: the frequency with which it occurs, and the business impact when it does (measured in cost, delay, or risk). Plot them, and focus your first improvement sprint on high-frequency, high-impact items.
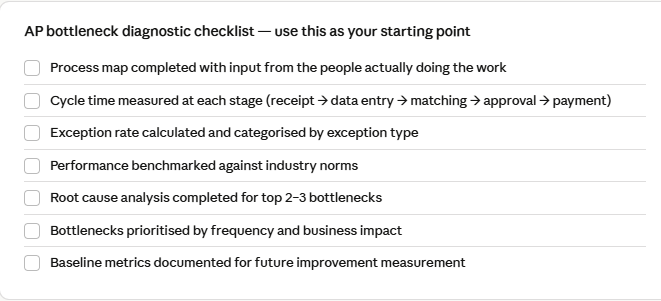
What good AP process improvement looks like after this
Bottleneck identification is the beginning of the improvement cycle, not the end. Once you know which constraints are structural, which are procedural, and which are technology gaps, you can make intelligent decisions about where to invest — whether that’s workflow redesign, policy change, ERP configuration, or automation.
Teams that complete this diagnostic rigorously before implementing solutions consistently see faster time-to-value, fewer failed implementations, and more durable improvements than those who start with a technology shortlist.
The organisations that achieve 80%+ straight-through processing rates didn’t get there by buying better software. They got there by understanding their specific failure points, fixing the underlying process, and then automating what was working.
The data you’ve gathered through this process — cycle times by stage, exception categories and rates, root causes — also becomes the baseline against which you’ll measure the success of whatever improvements you implement. Without it, “AP is better” is a feeling. With it, it’s a number.