


Key Takeaways
- Headcount growth in AP is not a natural requirement of rising invoice volume; it is a result of manual, linear process design that scales poorly.
- Benchmark data from APQC shows a wide cost gap between manual and highly automated AP operations, proving that efficiency is structurally achievable, not marginal.
- Shared Services Centers often centralize inefficient workflows rather than redesigning them, which is why cost targets frequently remain unmet even after consolidation efforts.
- Research from Ardent Partners indicates that most AP teams spend the majority of their time on repetitive, rule-based tasks like data entry, approvals, and exception handling.
- As automation maturity increases, AP shifts from transactional processing to exception management and financial intelligence, reducing dependency on headcount while improving financial control and decision-making capability.
Something quietly breaks inside a shared services centre when it reaches a certain size.
The team is working hard. The invoices are getting processed. Suppliers are mostly getting paid on time. By every surface measure, the AP function is doing its job.
And yet, every six months, there is another headcount request. Every year, the AP budget grows. Every time the business adds a new subsidiary or wins a major contract, the first conversation is about how many people will need to be hired to handle the additional volume.
Nobody designed it this way. It just became the only available answer to a question that nobody stopped to examine: why does more invoice volume always require more people?
The organisations that have asked — and honestly answered — that question have found something surprising. The link between AP volume and AP headcount is not a law of nature. It is a design flaw. And financial process automation is how leading shared services centres are engineering it out.
The Number That Reframes the Problem
In 2023, the American Productivity & Quality Center (APQC) published its annual benchmarking data on AP operations. The median cost to process a single invoice manually across large organisations: $10.18. The cost at top-quartile, highly automated organisations: $2.36.
That gap — roughly $8 per invoice — does not sound dramatic until you multiply it. An SSC processing 15,000 invoices a month at median cost spends $1.8 million a year on AP processing. The same volume, at top-quartile efficiency, costs $425,000.
The difference is not staffing quality or management discipline. APQC’s research is consistent on this point: the primary driver of that performance gap is the degree to which financial process automation has replaced manual handling in the invoice lifecycle.
The organisations at the top of those benchmarks are not running leaner teams under greater pressure. They are running fundamentally different processes — ones where the majority of invoices move from receipt to payment without a human being touching them at all.
Why SSCs Were Supposed to Solve This — and Often Don’t
The Shared Services Center model was built on straightforward logic: consolidate dispersed finance operations, standardise the processes, and achieve economies of scale.
It works, but only to a limited extent. Consolidation does reduce duplication. Standardisation does improve consistency. But neither addresses the underlying structure of manual AP work, which scales linearly with volume regardless of how centralised or standardised it is.
What many organisations discover, a few years into their SSC journey, is that they have successfully centralised an inefficient process. They have built a more organised version of the same manual workflow, which is now simply larger and more visible.
A 2022 Deloitte Global Shared Services Survey found that cost reduction remains the top priority for SSC leaders — cited by 70% of respondents — yet fewer than half reported hitting their cost targets in the prior year. The most commonly cited barrier: inability to scale without proportional headcount increases.
This is headcount dependency at organisational scale. And it persists not because SSC leaders lack ambition, but because the process underneath the centre was never redesigned — only relocated.
What Is Actually Happening Inside a Manual AP Day
he abstract case for change becomes concrete when you look at where AP team hours actually go.
A 2021 study, tracking time allocation across 250 AP functions, found the following breakdown in organisations with low automation maturity:
- 38% of AP staff time spent on manual data entry and document handling
- 22% of AP staff time spent on approval follow-up and status communication
- 19% of AP staff time spent on exception investigation and resolution
- 12% of AP staff time spent on supplier queries and payment status requests
- 9% of AP staff time spent on reporting, reconciliation, and audit support
Add up the first four categories, and you find that 91% of team capacity is consumed by work that is, in principle, rule-based and repeatable — work that follows logic that could be documented, systematised, and automated.
That 9% at the bottom — reporting, reconciliation, and audit support — is the work that actually requires financial judgment. In most manual AP functions, it gets the least attention, because there is rarely time left for it.
This is not a people problem. It is a prioritisation problem created by a process design that was never built for the volumes it now carries.
The Specific Costs Nobody Is Budgeting For
The visible cost of manual AP is headcount. The invisible costs are larger — and largely unmeasured in most SSCs.
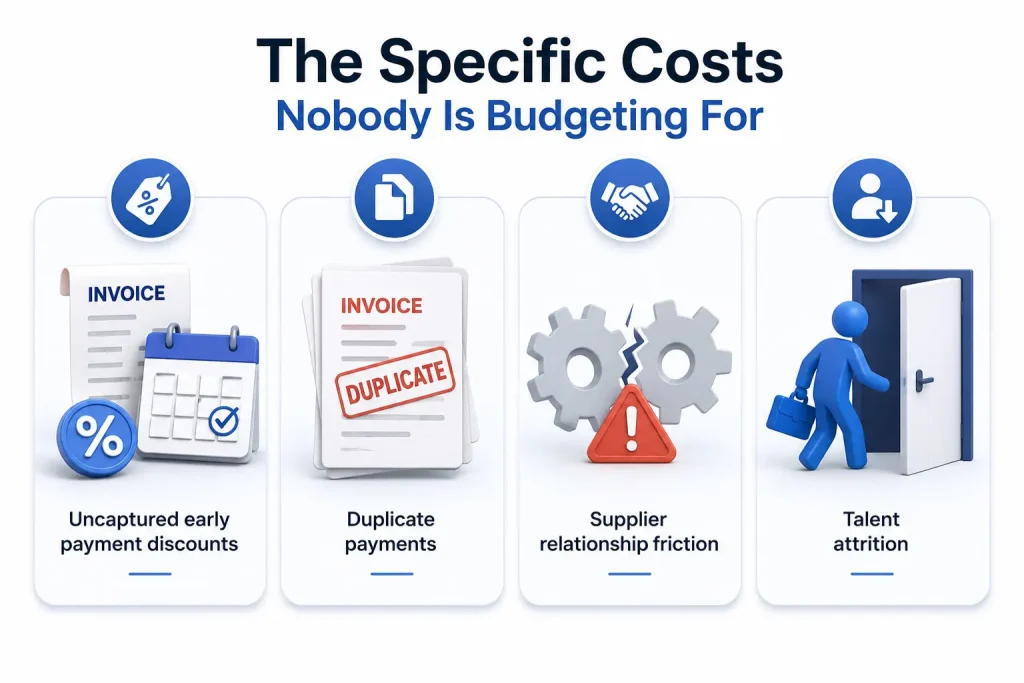
- Uncaptured early payment discounts. Many vendor contracts include dynamic discount terms — typically 1–2% for payment within 10 days. When AP cycle times run to 14–21 days in a manual environment (the median, per APQC), those discounts go uncaptured systematically. For an organisation with £40 million in annual vendor spend, uncaptured 1.5% discounts represent £600,000 per year in unrealised savings – not as a one-time miss, but as a recurring annual cost of slow processing.
- Duplicate payments. APQC estimates that between 0.1% and 0.5% of invoices in manual AP environments result in duplicate payments. On 180,000 invoices per year, even the low end of that range produces 180 duplicate payments. Recovery through audit is possible but rarely complete — and the staff time consumed in the recovery process is itself a cost.
- Supplier relationship friction. When suppliers lack visibility into invoice status, they call AP teams for updates. Ardent Partners found that supplier status queries account for 12% of AP staff time in low-automation environments — a figure that drops to under 2% in highly automated SSCs with supplier portal access. That 10-point difference in staff time is not a minor operational detail. At scale, it represents a team that is either answering phones or doing finance.
- Talent attrition. The voluntary turnover rate in transactional AP roles averages 24% annually, according to the Institute of Finance & Management — nearly double the rate in analysis-orientated finance roles. Each departure in a 20-person AP team costs an estimated £8,000–£12,000 in recruitment and onboarding before accounting for the productivity loss during the gap and ramp period. For an SSC that is structurally dependent on headcount, attrition is not an HR problem. It is a direct operating cost.
What Changes When the Process Is Redesigned
The Shared Services Centers that have moved furthest on financial process automation describe a similar sequence of change — not a technology transformation, but a process transformation enabled by technology.
The first thing that changes is where human attention goes. When the automation layer handles invoice capture, data extraction, PO matching, and approval routing, the AP team’s working day changes fundamentally. Instead of processing invoices, they manage exceptions. Instead of chasing approvers, they monitor dashboards. The work that remains is the work that genuinely requires judgment — and there is now time to do it properly.
The second thing that changes is the relationship between volume and cost. Gartner’s 2023 Finance Function Survey found that organisations with high AP automation maturity reported an average cost increase per unit of volume growth that was 32% lower than that of peers with low automation maturity. Put plainly: when business activity increases and invoice volumes rise, automated SSCs absorb the increase at a fraction of the cost that manual SSCs pay for the same growth.
The third thing that changes is what the SSC can offer the business. When AP is no longer consuming the team’s full capacity, Shared Services Centers gain the ability to move upstream—providing cash flow forecasting, payment optimisation analysis, and supplier intelligence that were previously impossible to resource. The SSC stops being a cost centre that justifies its existence by processing invoices and starts being a finance function that contributes to decisions.
This is the transformation that financial process automation makes possible. Not a smaller team — a more capable one.
The Question That Surfaces the Real Opportunity
There is a diagnostic question that tends to sharpen this conversation quickly inside SSC leadership teams:
If your invoice volume doubled tomorrow, what would you do?
In a headcount-dependent AP function, the answer is ‘hire’. Fast, if possible. Manage the backlog in the meantime. Accept the temporary quality dip.
In an automated AP function, the answer is to adjust capacity settings in the platform. Monitor exception rates. Possibly add one senior team member to handle the increase in complex exceptions.
The gap between those two answers is the size of the opportunity. And the organisations that have recognised it are not waiting for perfect conditions to act on it — they are starting with a clear measurement of where they are today, identifying the highest-friction points in their current process, and building a business case grounded in their own data rather than industry averages.
That is the starting point: not a technology decision, but a diagnostic one. What does AP actually cost you, end to end, today? Where does your team’s time actually go? And what would it be worth — in direct cost savings, in uncaptured discounts recovered, and in reduced attrition — to change that?
The answers to those questions are the foundation of every serious AP automation business case. And they are available to any SSC that is willing to look at the numbers honestly.
Three Things You Can Do This Week
Here are three concrete actions any SSC or finance leader can take right now — before any vendor conversation, before any budget approval, before any technology decision: