


- Faster Service Response often depends more on operational coordination than on the repair itself.
- Service response automation eliminates delays between ticket intake, validation, and dispatch.
- Hyperautomation can reduce triage and dispatch time from hours to minutes in many service environments.
- Automation improves technician utilization by removing manual coordination work.
- Organizations implementing hyperautomation frequently see improved SLA compliance and higher customer trust.
In service operations, time behaves differently than most executives assume.
A delay of fifteen minutes might sound trivial in a boardroom discussion. On the ground, that same delay can cascade across multiple systems—ticket queues grow, technicians sit idle waiting for approvals, customers call twice, sometimes three times, and service teams begin firefighting instead of operating.
What makes this problem more frustrating is that most organizations already have the necessary systems: CRM platforms, ticketing systems, asset management tools, and scheduling software. Yet service response automation remains incomplete because the real bottlenecks exist between those systems rather than inside them, leading to delays in processes such as checking if a warranty is valid or obtaining necessary approvals.
Someone still needs to:
- Check if a warranty is valid
- Confirm equipment serial numbers
- Assign a technician based on availability
- Validate SLA priority
- Notify the customer
Individually, none of these tasks are complex. Together, they create friction that stretches service response times.
And customers notice.
A recent service operations study across manufacturing and telecom environments showed that nearly 38% of service delays occur during ticket triage and assignment—not during the actual repair process.
That’s the kind of inefficiency hyperautomation targets directly.
Why Traditional Service Operations Struggle with Speed
Most service teams don’t lack tools. They lack orchestration.
Over the past decade, organizations digitized service workflows. Tickets are logged digitally. Customer records exist in CRM platforms. Dispatching tools manage technician routes.
Yet a large portion of the work still looks like this:
- A request enters the system via email or portal
- A service coordinator reviews the ticket
- Data is manually checked against warranty databases
- Priority is assigned
- Dispatch is scheduled
- Customer notifications are sent
The coordination overhead alone can consume 20–40 minutes per service request, depending on complexity. Multiply that across thousands of monthly service requests, and you begin to understand why faster service response becomes difficult to achieve through staffing alone.
Hiring more coordinators doesn’t solve the structural problem. It just spreads the workload.
Hyperautomation approaches the issue differently.
Instead of optimizing individual tasks, it removes human intervention from the entire triage-and-dispatch sequence, thereby streamlining the process and increasing efficiency in service response times.
Where Service Response Automation Changes the Equation
Service response automation works best when applied to decision-heavy workflows rather than physical tasks.
The goal isn’t to automate technicians fixing equipment. It is intended to automate the operational machinery that supports those repairs.
Hyperautomation systems typically perform tasks such as:
- Automated ticket classification using AI models
- Warranty and asset validation through system integrations
- SLA priority calculation
- Intelligent technician assignment
- Real-time notification triggers
But here’s the nuance many automation discussions skip. Speed improvements don’t come from automating one step. They come by eliminating the waiting time between steps.
A manual triage process may only take five minutes of actual work, but if the ticket sits in a queue for thirty minutes before someone reviews it, the effective delay is far larger.
Hyperautomation removes that waiting time. And the impact shows up clearly in operational metrics.
Also read: Hyperautomation in Manufacturing: Beyond Cost Reduction
Case Study 1: Manufacturing Equipment Service Desk Transformation
A global manufacturing company operating heavy machinery across North America faced a familiar problem.
Service requests for equipment failures were arriving through multiple channels—email, customer portals, and phone calls. The service desk had grown over time, but the process remained highly manual.
Typical workflow:
- A request arrives via email
- Service coordinators manually log the ticket in CRM
- Warranty status checked through ERP
- Technician availability reviewed in a separate dispatch tool
- SLA priority determined manually
Even experienced coordinators required 25–30 minutes to process each request.
The company implemented service response automation using AI-driven ticket classification combined with orchestration bots.
Key automation steps included:
- Automatic extraction of equipment serial numbers from incoming emails
- Warranty validation through ERP APIs
- SLA calculation based on contract tier
- Technician matching using skill, location, and availability
- Customer notification triggered automatically
Results after six months:
| Metric | Before Automation | After Automation |
| Average ticket triage time | 28 minutes | 3 minutes |
| First response time | 2.6 hours | 18 minutes |
| Technician utilization | 63% | 81% |
| Service backlog | Reduced by 42% |
Interestingly, the company did not reduce headcount. Instead, service coordinators shifted toward exception handling—complex cases where automation flagged unusual conditions.
Case Study 2: Telecom Field Service Dispatch Optimization
Telecom service operations deal with a different kind of complexity.
Service calls often involve multiple layers of validation—network diagnostics, location mapping, technician skills, and SLA guarantees. A telecom provider operating in Europe faced rising customer complaints around slow service response.
Internal investigation revealed something surprising.
The actual technician travel time wasn’t the main issue. The bottleneck was dispatch coordination.
Tickets were waiting in internal queues before technicians were even assigned. The organization implemented hyperautomation across the dispatch process.
Automation handled several key tasks:
- Automatic network diagnostics triggered when a fault was logged
- AI classification of service priority based on outage impact
- Real-time technician route optimization
- Automated dispatch approvals for low-risk tickets
The changes dramatically improved faster service response metrics.
Performance improvements included:
- Dispatch assignment time dropped from 45 minutes to under 5 minutes
- Customer acknowledgment messages sent within 2 minutes of ticket creation
- Same-day service completion rates increased from 54% to 79%
One operations director commented that the biggest shift wasn’t technological. It was psychological.
Once technicians trusted that dispatching decisions were accurate, they stopped second-guessing assignments and simply executed.
Case Study 3: Healthcare Equipment Maintenance Requests
Healthcare environments introduce an entirely different set of constraints.
Hospitals rely on medical devices that must remain operational—MRI machines, ventilators, diagnostic equipment. Service delays can impact patient care.
A provider of biomedical equipment that services hospitals across Asia faced constant delays in responding to maintenance requests.
Requests arrived through multiple channels:
- Biomedical staff email requests
- Vendor portals
- Emergency service phone calls
Manual processing often delayed technician dispatch. The organization implemented service response automation focusing on maintenance triage.
Automation components included:
- Natural language processing to interpret email requests
- Device asset lookup using hospital inventory systems
- Warranty and service contract verification
- Automated technician dispatch for critical equipment
The results were immediate.
Key performance metrics changed significantly:
- Average response time: 90 minutes → 12 minutes
- Emergency request dispatch: 20 minutes → under 3 minutes
- Ticket routing errors: reduced by 65%
But there was an unexpected benefit. Hospitals reported improved trust in service reliability, leading to higher renewal rates for maintenance contracts.
Speed, it turns out, can influence customer loyalty just as much as service quality.
The Metrics That Matter in Faster Service Response
Organizations often track the wrong indicators when measuring service performance.
Ticket volume or technician utilization alone do not provide a complete picture. What truly reflects faster service response are metrics tied to time-based operational flow.
Important ones include:
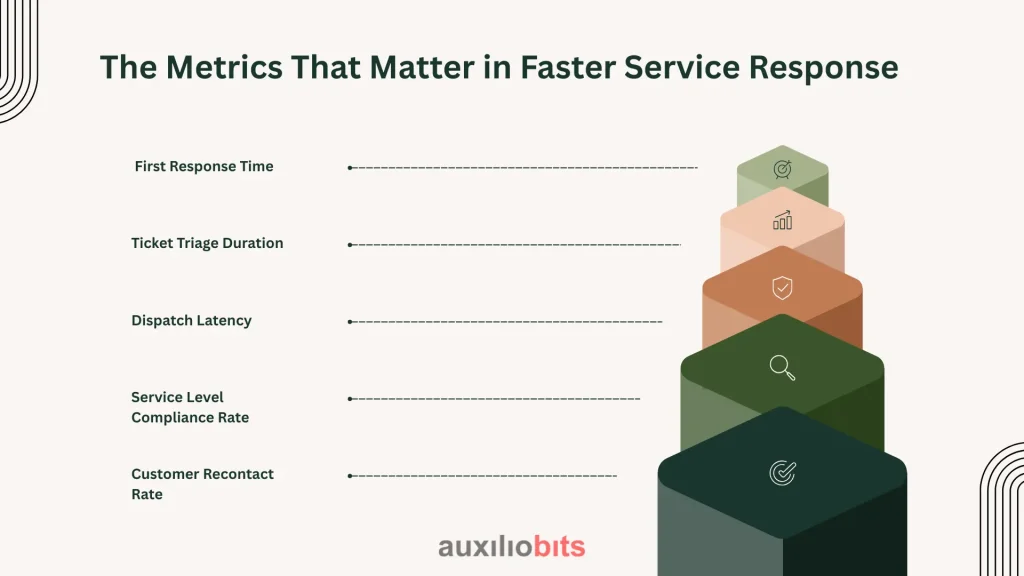
1. First Response Time (FRT)
The First Response Time (FRT) refers to the speed at which customers receive an acknowledgement or action.
2. Ticket Triage Duration
The duration of ticket triage refers to the time needed to classify, validate, and assign requests.
3. Dispatch Latency
There is a delay between the creation of a ticket and the assignment of a technician.
4. Service Level Compliance Rate
Percentage of tickets resolved within SLA.
5. Customer Recontact Rate
A surprisingly revealing metric. If customers reach out to support again before resolving the issue, it indicates a breakdown in the response chain.
Hyperautomation often reduces recontact rates dramatically because the system acknowledges requests instantly, meaning it can automatically handle and respond to customer enquiries without human intervention. Customers don’t feel ignored.
And perception matters almost as much as resolution speed.
When Hyperautomation Works — And When It Doesn’t
Despite the success stories, hyperautomation isn’t a universal solution.
There are scenarios where service response automation struggles.
For example
- Highly unstructured service requests with vague descriptions
- Situations requiring expert technical judgment early in the workflow
- Organizations with fragmented data architecture
Automation depends heavily on accessible data. If equipment records are inconsistent or customer contracts aren’t standardized, automation logic becomes unreliable.
In those cases, organizations need data cleanup before pursuing automation aggressively.
Another misconception: automation eliminates service roles.
In reality, automation tends to elevate service teams toward higher-value tasks.
Instead of manually routing tickets, staff focus on:
- Escalation management
- Customer communication during complex incidents
- Root cause analysis
Practical Components of a Service Response Automation Architecture
A typical hyperautomation environment supporting service response includes several layers. Some organizations implement these incrementally; others build the full stack at once.
Key components often include:
1. AI Classification Models
Used to interpret incoming requests. These models categorize service tickets by issue type, urgency, and asset type.
2. Orchestration Engines
Coordinate actions across CRM, ERP, asset management systems, and dispatch tools.
3. Automation Bots
Handle repetitive tasks like ticket creation, contract verification, and notification triggers.
4. Decision Engines
Apply business rules to determine SLA priority or dispatch eligibility.
5. Integration APIs
Allow data exchange between otherwise disconnected platforms. The architecture doesn’t replace core systems. It simply connects them more intelligently.
The Compounding Impact of Faster Response Times
Organizations often pursue faster service response because customers demand it.
But internally, the benefits compound in ways leadership doesn’t always anticipate.
For example:
- Reduced ticket backlog improves team morale
- Faster dispatch increases technician productivity
- Service teams gain capacity without hiring additional sta
And there’s a broader operational effect. When response times improve, service organizations shift from reactive firefighting toward proactive maintenance.
Technicians spend less time chasing emergencies and more time preventing them.
Which ultimately creates a virtuous cycle.
Fewer emergencies mean fewer urgent tickets.
Fewer urgent tickets mean faster response times.
That’s the quiet promise behind hyperautomation—not just speed, but operational stability.
And for service organizations juggling thousands of requests each week, that stability might be the most valuable outcome of all.