


Key Takeaways
- Labor savings alone don’t capture automation ROI. Manufacturers must track broader financial and operational performance indicators.
- Metrics like cost per unit, working capital efficiency, and revenue leakage reveal deeper financial impact than traditional ROI formulas.
- Operational indicators such as cycle time, downtime, and exception rates often show automation benefits earlier than financial metrics.
- Automation improves decision-making speed and data visibility, which can significantly influence production planning and quality management.
- Successful automation ROI measurement requires a balanced framework combining financial performance, operational efficiency, risk indicators, and decision enablement.
Manufacturing leaders usually agree that automation creates value. The debate is usually about how much value it creates—and more importantly, whether that value can actually be measured.
Most automation initiatives still get evaluated using simplistic ROI calculations: labor savings versus implementation cost. That approach might have worked when automation meant a single robotic arm on an assembly line. However, modern manufacturing automation, particularly with the introduction of software bots, AI systems, and workflow orchestration, generates value in much more nuanced ways.
The uncomfortable truth is that many organizations are underestimating the return they are already getting, while others are chasing misleading metrics that make projects look successful on paper but deliver very little operational improvement.
If the goal is to measuring automation ROI, manufacturers need to move beyond surface-level calculations and focus on the financial and operational indicators that actually reflect business performance.
Because automation doesn’t just reduce labor hours. It reshapes how factories operate.
Why Traditional ROI Calculations Fall Short
The typical automation ROI formula is simple: (Labor Savings – Automation Cost) ÷ Automation Cost
It sounds logical. Unfortunately, it captures only a fraction of the picture.
Manufacturing processes are interconnected systems. Automating one step often produces downstream effects that ripple across production planning, quality control, finance operations, and supply chain performance.
A procurement automation project might reduce invoice processing time by 70%. But the real benefit may show up somewhere else entirely—like improved supplier relationships or faster production scheduling.
Some of the most significant automation benefits include:
- Reduced rework and scrap rates
- Faster cycle times across production stages
- Improved planning accuracy
- Lower working capital requirements
- Fewer operational disruptions
None of these appear in a basic ROI calculation. Which raises a question manufacturing leaders often overlook:
Are we measuring automation success, or just measuring what’s easy to quantify?
Also read: Why Manufacturing Plants Need Cognitive Control Towers
Financial Metrics That Reflect Automation Value
When evaluating automation ROI in manufacturing, financial indicators should connect directly to how automation changes business performance—not just departmental productivity.
Several metrics consistently reveal the real impact.
1. Cost per Unit of Production
This metric often exposes automation value faster than headcount reduction. If automation reduces process delays, improves machine utilization, or minimizes errors, unit costs decline even if labor headcount remains unchanged.
Manufacturers frequently expect automation to eliminate jobs. In practice, it often allows companies to increase production without increasing staffing levels.
That distinction matters.
Consider a mid-sized electronics manufacturer that automated quality inspection reporting across three assembly lines. Labor savings were minimal. Operators still ran the same stations.
But defect documentation improved dramatically, which reduced scrap and rework.
The result:
- 18% reduction in defective output
- Lower material waste
- Noticeably improved unit cost
The ROI appeared not in labor metrics but in production economics.
2. Working Capital Efficiency
Automation quietly affects working capital more than many executives realize.
Manufacturing finance teams constantly deal with timing gaps:
- Delayed invoicing
- Slow order confirmations
- Manual inventory reconciliation
- Supplier payment delays
Automation can compress these gaps.
Metrics worth monitoring include:
- Days Sales Outstanding (DSO)
- Inventory turnover ratios
- Days Payable Outstanding (DPO)
- Cash conversion cycle
When automation accelerates document processing, order approvals, or reconciliation tasks, cash begins moving faster through the business.
One automotive supplier introduced automated order validation and invoice generation. Nothing dramatic changed operationally. But invoice cycle time dropped from six days to less than one. The CFO noticed the effect almost immediately—DSO improved by nine days within two quarters. That improvement had a far larger financial impact than the labor savings that justified the project.
3. Revenue Leakage Prevention
Manufacturers rarely talk about revenue leakage openly. Yet it’s common.
Examples include:
- Incorrect pricing applied during order entry
- Missed surcharge calculations
- Contract terms inconsistently applied
- Unbilled services or adjustments
Manual processes are the usual culprit. Automation systems that validate contracts, enforce pricing rules, or trigger billing events reduce these losses significantly.
The challenge? Leakage rarely appears in financial reports because it often goes unnoticed.
Companies frequently discover a loss of 2–5% of potential revenue due to inconsistent execution after introducing automated controls.
That’s not a small number.
4. Cost of Quality
Quality failures create a complex financial burden.
Direct costs include scrap, rework, warranty claims, and replacement shipments. But the indirect costs—production delays, customer dissatisfaction, and reputational damage—are harder to quantify.
Automation affects quality in multiple ways:
- Automated inspection reporting
- Standardized compliance documentation
- Predictive maintenance alerts
- Process monitoring systems
Manufacturers tracking Cost of Poor Quality (COPQ) before and after automation often see surprising results.
One industrial equipment company automated maintenance scheduling and inspection documentation across its plant network.
Maintenance expenses didn’t decrease immediately. But unplanned downtime dropped sharply within six months—and warranty claims fell nearly 12% the following year. The real ROI appeared a full fiscal cycle later.
Operational Metrics That Reveal Automation Impact
Financial indicators matter, but operational metrics usually show automation effects sooner. They also help identify whether automation is improving system performance or simply shifting work around.
Several operational indicators are particularly useful.
1. Cycle Time Across Key Processes
Automation’s first visible impact is usually speed. But measuring individual task completion time is misleading. What matters is end-to-end process cycle time.
For example: Order-to-cash workflows often contain dozens of steps—many of which involve waiting rather than processing.
Automation shortens these delays by:
- Triggering approvals automatically
- Routing documents instantly
- Eliminating manual handoffs
Manufacturers should track cycle times for processes such as:
- Order processing
- Vendor onboarding
- Production planning adjustments
- Quality reporting
- Maintenance scheduling
Even modest improvements can compound across operations. A process that shortens from 5 days to 2 days might reduce inventory buffers, accelerate revenue recognition, and improve customer delivery performance.
2. Exception Rates
One of the most underused metrics in measuring automation ROI is exception frequency. Automation systems are designed to handle standard scenarios. Exceptions require human intervention.
Tracking how often exceptions occur—and why—reveals two important things:
- Process stability
- Automation effectiveness
If automation reduces exception rates over time, it means the system is improving operational consistency. If exceptions remain high, the underlying process probably needs redesign rather than automation.
A pharmaceutical manufacturer experienced these challenges firsthand. Their automated order validation system initially produced hundreds of daily exceptions. The technology worked fine. The real problem was inconsistent product master data. Automation simply exposed an issue that had been hidden for years.
3. Production Downtime
Downtime is expensive. Everyone in manufacturing knows that. But downtime data is often underutilized when assessing automation ROI.
Automation contributes to downtime reduction through:
- Predictive maintenance systems
- Automated incident detection
- Real-time machine monitoring
- Intelligent scheduling adjustments
When downtime decreases—even slightly—the productivity gains can be substantial. A packaging plant introduced predictive monitoring on several aging machines. The system didn’t prevent every failure.
But it detected performance anomalies early enough to schedule maintenance during planned shutdown windows. Downtime fell by 11% across two quarters. No labor savings were recorded. Yet overall plant throughput increased significantly.
4. Throughput Consistency
Manufacturing leaders tend to focus on peak performance. Automation often improves something different: consistency. Production lines rarely operate at maximum output all day. Variability creeps in through human error, coordination delays, or inconsistent process execution.
Automation helps standardize these steps.
Metrics worth observing include:
- Poduction variability across shifts
- Order fulfillment reliability
- Schedule adherence rates
Consistent throughput simplifies planning, reduces buffer inventory, and stabilizes supply chains. That stability is difficult to assign a dollar value to—but operational leaders know how valuable it becomes during demand surges.
The Hidden ROI of Automation: Decision Quality
Some automation benefits don’t fit neatly into operational dashboards.
Better data.
Faster reporting.
Clearer visibility into production performance.
These improvements change how managers make decisions.
Imagine a production manager who previously waited two days for consolidated quality reports. Automation delivers the same data in near real time.
Suddenly:
- Quality issues are identified earlier
- Production adjustments happen faster
- Supplier defects are escalated sooner
Is that automation ROI? Technically yes—but not in a traditional financial sense.
It’s decision velocity, which is increasingly becoming one of the most valuable assets in modern manufacturing.
When Automation ROI Calculations Fail
Not every automation project succeeds. Sometimes ROI projections fail for reasons that have little to do with technology.
Common pitfalls include:
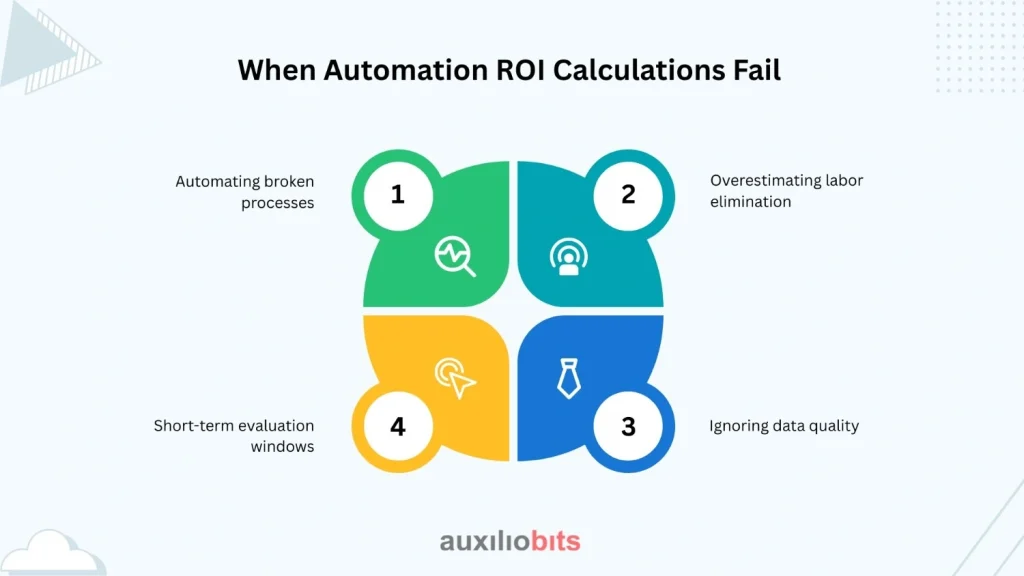
1. Automating broken processes
Poorly designed workflows simply accelerate inefficiency through automation.
2. Overestimating labor elimination
Manufacturing automation often reallocates labor rather than eliminating it.
3. Ignoring data quality
Automation systems rely on accurate master data. Without it, exception rates explode.
4. Short-term evaluation windows
Some benefits—particularly quality improvements—take months to appear. Automation ROI is rarely judged within the first quarter after deployment.
A Practical Framework for Measuring Automation ROI
Manufacturers evaluating automation ROI in manufacturing can use a more balanced measurement approach.
Instead of relying on one or two indicators, track performance across four categories:
1. Financial performance
- Unit production cost
- Revenue leakage reduction
- Working capital improvements
2. Operational efficiency
- End-to-end cycle times
- Exception rates
- Production throughput
3. Risk and quality indicators
- Cost of poor quality
- Compliance accuracy
- Downtime frequency
4. Decision enablement
- Reporting latency
- Visibility across operations
- Planning accuracy
This multidimensional view captures automation’s broader influence on the business. And frankly, it reflects how manufacturing operations actually function.
A Final Observation
One pattern appears repeatedly across manufacturing organizations implementing automation.
At first, leaders try to justify automation using labor savings. But over time, the narrative shifts.
They start talking about process stability, faster planning, lower defect rates, and more predictable operations. In other words, automation stops being viewed as a cost-reduction tool.
It becomes an operational capability. And once that shift happens, the conversation around Measuring Automation ROI becomes far more meaningful—because manufacturers are finally evaluating what automation truly changes.
Not just how many hours it saves.