


Key Takeaways
- Faster close doesn’t always mean better—stability and fewer post-close adjustments matter more.
- Audit readiness is less about documents existing and more about traceability and consistency.
- High automation rates are meaningless if core bottlenecks like reconciliations and intercompany ones aren’t addressed.
- Exception patterns reveal deeper process design flaws, not just operational inefficiencies.
- The most valuable manufacturing finance KPIs are the ones that expose uncertainty—not just performance.
There’s a quiet shift happening in manufacturing finance teams. Not in the ERP systems—they’ve been “modern” for years—but in how CFOs judge performance. The conversation is no longer about whether automation exists. It’s about whether it’s working where it matters.
And if you sit in enough monthly reviews, two themes keep surfacing:
“Why does closure still take so long?”
“Why are we scrambling every audit season?”
Everything else—dashboards, analytics, even AI pilots—feels secondary when those two questions remain unresolved.
So when we talk about Finance KPIs in manufacturing, especially in an automation context, we’re not talking about vanity metrics or generic efficiency ratios. We’re talking about indicators that reveal whether finance operations are actually becoming predictable, controllable, and defensible.
This is where manufacturing finance KPIs need a more grounded lens.
The Problem With Most Finance KPIs
A lot of finance dashboards look impressive. Cycle times, throughput, exception rates, cost per invoice—all useful. But they often miss something critical: they don’t reflect operational stress.
Take close time, for example. A report might say “5 days”. Sounds efficient. But what it doesn’t tell you:
- Were those 5 days smooth—or chaotic?
- How many manual interventions happened behind the scenes?
- How many entries were adjusted post-close?
Same with audit readiness. Many teams assume they’re “ready” because documents exist somewhere. Then the auditors show up, and suddenly the following happens:
- Files are scattered across emails and shared drives
- Supporting evidence is inconsistent
- Control logs are incomplete
Why Close Time Is Still Stubbornly High
You’d expect that with decades of ERP adoption, close cycles would shrink dramatically. In reality, many manufacturing firms still hover between 5 to 10 days, sometimes more for complex entities.
Why? This is because most delays are not within the ERP. They sit around it.
Where Close Breaks Down
Let’s be blunt—closing delays rarely come from system limitations. They come from fragmented processes:
- Data arrives late from plant systems or third-party vendors
- Reconciliations depend on Excel files maintained manually
- Intercompany entries require back-and-forth approvals
- Adjustments get posted after multiple review cycles
Even worse, these issues compound. One delay early in the cycle cascades into multiple downstream bottlenecks. Automation should address these problems. But often it doesn’t—at least not meaningfully—because it’s applied selectively, not holistically.
Also read: Personal Finance Coaching Bots Using LangChain Agents
The KPIs That Reflect Close Efficiency
If you want to understand whether automation is improving close performance, these are the metrics worth tracking—not in isolation but together.
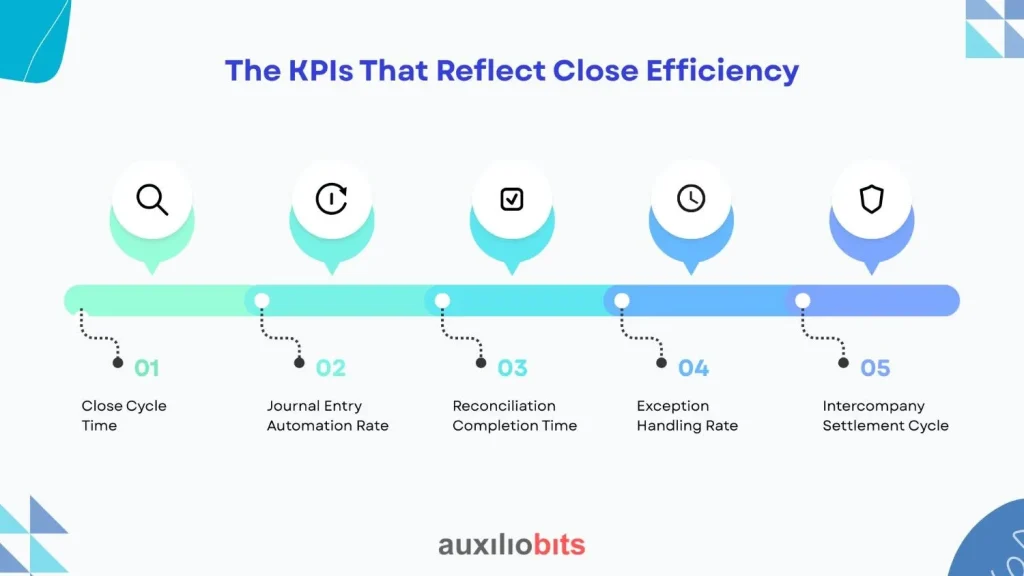
1. Close Cycle Time
Yes, it’s still the headline metric. But treat it carefully.
What matters isn’t just how long the close takes—it’s the following:
- Variance in close time month-to-month
- Dependency on manual interventions
- Number of post-close adjustments
4-day close with heavy rework is worse than a 6-day close that’s stable and clean.
2. Journal Entry Automation Rate
This metric is one of the most telling finance KPIs in an automated environment.
Not all entries should be automated, but a surprising number can be:
- Accruals based on predefined logic
- Recurring adjustments
- Allocation entries
When this KPI is low, it usually signals one of two things:
- Processes aren’t standardized enough
- Teams don’t trust automation (often for good reason)
A manufacturing client once automated nearly 60% of their recurring journal entries—and still kept manual overrides. The intriguing part? Errors decreased, not increased.
3. Reconciliation Completion Time
This KPI tends to be underestimated. Yet, it’s often the longest pole in the tent.
Track:
- Time taken to complete reconciliations per account
- Number of open reconciling items at close
- Age of unreconciled items
If reconciliations stretch beyond Day 3 or Day 4, your close timeline is already compromised.
4. Exception Handling Rate
Automation doesn’t eliminate exceptions—it surfaces them faster.
A high exception rate usually indicates the following:
- Poor upstream data quality
- Incomplete business rules
- Misaligned process ownership
What matters is not just the number of exceptions, but:
- How quickly they’re resolved
- Whether similar exceptions repeat
Repeated exceptions are a design failure, not an operational one.
5. Intercompany Settlement Cycle
Manufacturing companies with multiple plants or legal entities know this pain well.
Intercompany mismatches can delay close by days.
Key metrics:
- Time to reconcile intercompany balances
- Number of unresolved discrepancies at close
- Frequency of manual adjustments
Automating matching logic here can dramatically reduce friction—but only if both sides of the transaction follow consistent rules. That’s where it often breaks.
Audit Readiness: The KPI No One Tracks Properly
Audit readiness is one of those concepts everyone agrees is important, but most people measure it poorly.
Most teams equate readiness with documentation availability. That’s only a partial understanding.
Real audit readiness is about traceability and confidence.
Can you answer without scrambling?
- Why was this entry posted?
- Who approved it?
- What data supports it?
- Has this control been executed consistently?
If answering those requires digging through emails or chasing people, you’re not audit-ready.
KPIs That Define True Audit Readiness
1. Documentation Coverage Ratio
Sounds simple, but it’s revealing.
- Percentage of journal entries with complete supporting documentation
- Percentage of reconciliations with attached evidence
What’s surprising is how often this falls below expectations—even in mature environments.
2. Audit Trail Completeness
This area is where automation really earns its place.
Track whether systems automatically capture:
- User actions
- Approval workflows
- Data changes
Manual logs are unreliable. Always have been.
3. Control Execution Consistency
Controls don’t fail because they’re poorly designed. They fail because they’re inconsistently executed.
Measure:
- Frequency of missed controls
- Variability in control execution timing
- Dependency on manual tracking
An automated control that runs consistently is far more valuable than a sophisticated one that runs sporadically.
4. Time to Fulfill Audit Requests
This is a honest KPI.
When auditors request information:
- How long does it take to respond?
- How many follow-ups are needed?
If responses take days, your processes aren’t structured—they’re reactive.
5. Post-Audit Adjustments
A subtle but important metric.
- Number of entries adjusted after audit review
- Materiality of those adjustments
Frequent post-audit changes indicate underlying issues in validation or control frameworks.
Where Automation Moves the Needle
There’s a tendency to think automation improves everything equally. It doesn’t.
In manufacturing finance, its impact is concentrated in a few key areas:
1. Standardization Before Automation
If processes vary across plants or business units, automation struggles.
You can’t automate:
- Inconsistent account structures
- Varying approval workflows
- Ad hoc reconciliation methods
This is where many initiatives stall—not because of technology, but because of organizational alignment.
2. Data Flow, Not Just Task Automation
Automating individual tasks (posting entries, sending emails) has limited impact.
What changes close time and audit readiness is end-to-end data flow automation:
- Data ingestion from source systems
- Validation rules applied upfront
- Automatic routing for approvals
Without this, you’re just accelerating fragments of a broken process.
3. Embedded Controls
This is often overlooked.
Instead of:
- Running controls after transactions
- Relying on manual reviews
Automation allows controls to be embedded directly into workflows.
Example:
- Preventing incorrect postings at entry
- Flagging anomalies before approval
- Enforcing documentation requirements automatically
This doesn’t just improve audit readiness—it reduces the need for audits to catch issues in the first place.
A Quick Reality Check: When KPIs Mislead
Not every improvement in KPIs reflects real progress.
Some examples:
- Faster close time achieved by cutting validation steps → leads to audit issues later
- Lower exception rates because exceptions are ignored or suppressed
- High automation rates in low-impact processes
There’s always a temptation to optimize what’s easy to measure. The harder (and more valuable) work is improving what’s messy and cross-functional.
The Shift CFOs Are Making
Manufacturing CFOs are starting to look beyond traditional finance KPIs.
The focus is shifting toward the following:
- Predictability over speed
- Traceability over volume
- Consistency over one-time efficiency gains
And that changes how automation is evaluated.
It’s no longer about the following:
- “How many processes are automated?”
But rather
- “Which bottlenecks have actually disappeared?”
- “Where do we still depend on human memory or effort?”
A Note on What Often Gets Ignored
There’s one uncomfortable truth: Finance transformation projects often avoid the hardest problems.
Things like:
- Intercompany complexity
- Plant-level data inconsistencies
- Cross-functional dependencies
Why? Because they require coordination beyond finance. But those are exactly the areas where the most meaningful KPI improvements lie.
Closing Thought
If your close process still feels like a controlled scramble—and your audit readiness depends on who’s available that week—then your KPIs are telling you something. Maybe not directly, but indirectly.
The numbers might look acceptable. The dashboards might even look polished.
But underneath, there’s usually a pattern:
- Workarounds disguised as processes
- Controls executed out of habit, not design
- Automation applied where it’s easiest, not where it matters
The real opportunity in manufacturing finance isn’t just speeding things up. It’s removing the uncertainty that forces teams to double-check, rework, and defend their outputs.
And when that happens, close time improves almost as a side effect. Audit readiness stops being an event.
That’s when your manufacturing finance KPIs start reflecting something real—not just something measurable.