


Key Takeaways
- Service Analytics reveals hidden operational patterns, helping manufacturers understand recurring failures and service inefficiencies.
- Pattern learning enables continuous improvement, shifting service teams from reactive fixes to proactive prevention.
- Connecting service data across systems—CRM, ERP, IoT, and technician notes—is essential for meaningful insights.
- Better pattern visibility improves field service outcomes, including higher first-time fix rates and reduced repeat visits.
- Service analytics manufacturing strategies ultimately reduce warranty costs and improve equipment reliability.
Manufacturing companies spent decades optimizing production lines. Most factories operate like finely tuned machines, utilising lean manufacturing, which focuses on minimising waste; Six Sigma, a set of techniques for process improvement; and predictive maintenance, which anticipates equipment failures before they occur.
Service operations, however, often lag behind. Field service teams still rely on spreadsheets, technician notes, CRM entries, and ERP logs that rarely connect into a coherent picture. The result is a familiar scenario: organizations generate enormous volumes of service data but struggle to extract meaningful insights.
This is where service analytics becomes transformative. Service Analytics goes beyond superficial dashboards that merely track ticket volumes or response times; it focuses on identifying patterns across service events, failures, technician actions, and customer environments.
In manufacturing environments, service analytics strategies have become a competitive differentiator. Product margins are tightening. After-sales services—maintenance contracts, warranty services, spare parts—often deliver higher profitability than the original equipment sale.
But that profitability depends on one thing: learning from service patterns fast enough to improve operations continuously. And most companies aren’t doing that very well, which results in missed opportunities for enhancing customer satisfaction and operational efficiency.
Why Traditional Reporting Fails Service Organizations
Most service organizations already have reporting. Monthly dashboards. SLA reports. Ticket resolution metrics. Technician utilization charts.
Yet when leadership asks deeper questions, the answers rarely appear.
Questions like:
- Why do certain equipment models fail repeatedly within the first year?
- Why do two technicians resolve the same issue differently?
- Why do certain customers generate disproportionately high service costs?
- Why do service tickets spike every quarter for a specific product line?
These questions require pattern recognition, not static reporting.
Traditional reports usually focus on metrics:
- Number of service tickets
- Average response time
- Resolution time
- Customer satisfaction score
These metrics are useful—but they rarely reveal systemic behavior.
Service analytics that support continuous improvement focus instead on patterns across time, assets, locations, and service actions.
Patterns such as:
- Repeated part replacements that point to design flaws
- Technician workarounds that indicate documentation gaps
- Service spikes tied to environmental conditions
- Warranty claims clustering around specific suppliers
These patterns exist in the data already. The difficulty lies in connecting them.
Understanding Pattern Learning in Service Operations
Pattern learning is not just another analytics buzzword.
In the context of service analytics, it means detecting recurring operational behaviors across service interactions—and turning those insights into operational improvements.
Think of pattern learning as the service equivalent of predictive maintenance, but broader.
Instead of analyzing only sensor data, pattern learning examines the entire service ecosystem:
- Failure types
- Technician diagnostics
- Spare parts usage
- Environmental factors
- Customer usage patterns
- Service response timelines
Over time, patterns begin to emerge.
For example:
A manufacturer might discover that:
- 35% of service calls for a specific industrial pump occur within 90 days of installation.
- Most failures involve the same pressure regulator component.
- Failures occur primarily in facilities operating above certain temperature thresholds, which can lead to increased wear and tear on the pump components, particularly the pressure regulator.
Suddenly, the problem isn’t “service inefficiency”. It’s a product-environment mismatch.
And that’s a completely different conversation. Pattern learning changes the focus from reactive service to systemic improvement.
The Data Sources That Power Service Analytics
The scattered nature of data is a simple reason why service analytics initiatives struggle. Service operations typically generate information across multiple systems.
Some of the most valuable data sources include:
1. Service management platforms
- Ticket history
- Resolution notes
- Escalation records
2. ERP systems
- Spare parts consumption
- Warranty claims
- Asset lifecycle data
3. Field technician reports
- Repair actions
- Observations
- Workarounds
4. IoT and machine telemetry
- Sensor alerts
- Operating conditions
- Equipment performance trends
5. Customer interaction channels
- support portals
- call logs
The challenge isn’t just collecting this data. It’s correlating events across systems.
Consider a common scenario in manufacturing service operations:
A service ticket is opened in a CRM system. The technician orders a spare part through ERP. The asset telemetry logs a fault code. The customer files a warranty claim weeks later.
Individually, each system records an event. But service analytics manufacturing frameworks connect these events into patterns. Without that correlation, valuable insights remain hidden.
How Pattern Learning Drives Continuous Improvement
Continuous improvement in service operations isn’t about fixing individual tickets faster. It’s about eliminating the root causes of recurring service events.
Pattern learning supports that goal in several ways.
1. Identifying Recurring Failure Modes
Repeated service incidents often signal underlying product or operational issues.
Patterns reveal:
- Design flaws
- installation errors
- training gaps
- supplier quality issue
Over time, organizations can move from reactive service to systemic failure prevention by implementing structured training programs and formalising knowledge-sharing practices among technicians.
2. Improving Technician Knowledge
Technicians often develop informal knowledge that never makes it into official documentation.
Service analytics helps surface patterns such as:
- common diagnostic shortcuts
- frequently replaced components
- effective troubleshooting sequences
This method allows organizations to:
- update service manuals
- improve technician training
- standardize successful repair methods
In many cases, the best knowledge already exists—it just lives in technician notes.
3. Reducing Repeat Service Visits
Repeat service visits are a major cost driver.
Patterns can highlight situations where:
- incorrect parts were dispatched
- diagnostics were incomplete
- service procedures were inconsistent
Analytics helps answer a question that frustrates service managers: Why did the first repair not resolve the issue?
Often the answer lies in patterns across hundreds of similar tickets.
4. Improving Spare Parts Planning
Service operations depend heavily on spare parts availability.
Pattern learning allows organizations to anticipate:
- which components fail most often
- which parts technicians carry unnecessarily
- which parts cause repair delays
This approach enables more accurate inventory planning and faster service resolution.
Operational Areas Where Service Analytics Delivers Impact
When implemented properly, service analytics touches multiple operational areas.
Some of the most visible improvements occur in:
1. Field Service Management
- technician routing efficiency
- repair time consistency
- first-time fix rates
2. Warranty Management
- fraud detection
- recurring defect identification
- supplier accountability
3. Customer Experience
- faster resolution cycles
- proactive service recommendations
- fewer repeat failures
4. Product Engineering Feedback
- real-world performance insights
- design improvement opportunities
- environmental usage analysis
Interestingly, the biggest value often appears outside the service department.
Product teams, supply chain managers, and quality engineers all benefit from the patterns service analytics reveals.
The Role of AI and Automation in Modern Service Analytics
Service data volumes have grown dramatically.
Technician notes alone can generate thousands of text records every month. Add IoT (Internet of Things) telemetry, warranty claims, and service logs, and the dataset becomes overwhelming.
Manual analysis simply doesn’t scale.
AI-driven analytics helps by:
- detecting correlations across large datasets
- extracting insights from technician text notes
- identifying anomaly patterns in equipment failures
- predicting emerging service issues
But automation must be applied carefully. Pattern detection tools sometimes identify correlations that aren’t meaningful.
For example, an analytics model might link failure rates to geographic regions, when the real cause is technician experience differences.
Human expertise still matters. Analytics tools highlight patterns—but service leaders interpret them.
Practical Steps to Implement Service Analytics in Manufacturing
- Organizations often underestimate how much groundwork is required before analytics becomes useful.
- Based on real implementations, a few steps consistently make the difference.
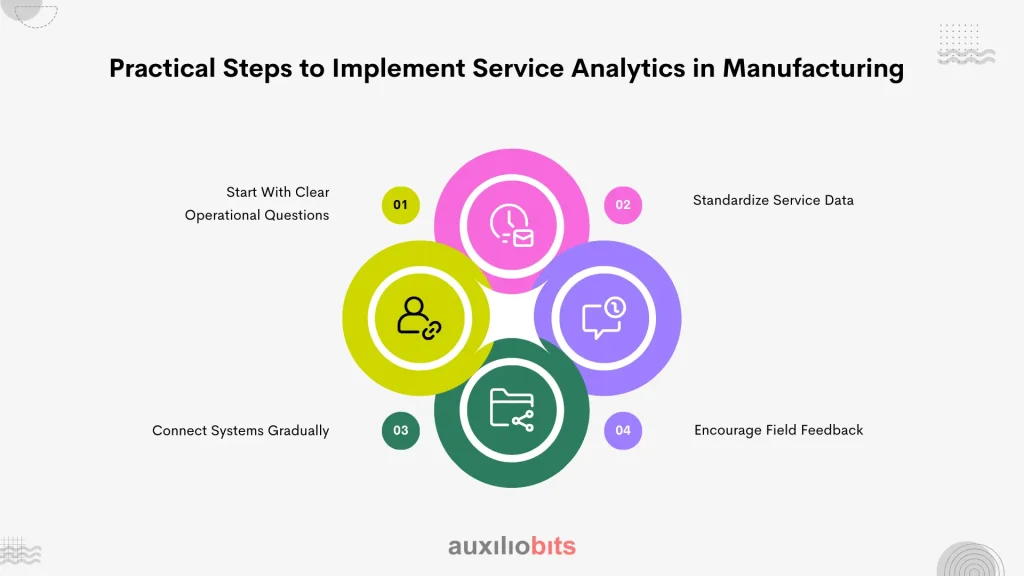
1. Start With Clear Operational Questions
Analytics projects fail when they begin with vague goals like “improve service efficiency”.
Better questions include:
- Which equipment models generate the highest repeat service calls?
- Which repairs require multiple technician visits?
- Which parts drive the highest warranty costs?
Specific questions lead to useful analysis.
2. Standardize Service Data
Technician notes can be inconsistent.
One technician writes, “Pump pressure drop.”
Another writes, “Flow issue.”
Another simply writes: “Customer complaint.”
Standardization helps analytics tools recognize patterns more effectively. Even simple steps—structured service codes, standardized failure categories—make a difference in improving the accuracy of customer feedback analysis and enhancing overall service quality.
3. Connect Systems Gradually
Service analytics rarely requires a massive data platform at the start.
Instead
- integrate ticketing data
- add warranty claims
- incorporate asset information
Over time, organizations can include telemetry data and supply chain systems. Attempting to integrate everything at once usually delays progress.
4. Encourage Field Feedback
Technicians often spot patterns before analytics systems do. Encouraging structured feedback from field teams can accelerate pattern discovery. Some companies even hold monthly service pattern reviews where technicians discuss recurring issues, which helps in identifying trends and improving service efficiency.
Common Pitfalls That Derail Analytics Initiatives
Not every service analytics manufacturing project succeeds. Several common pitfalls appear repeatedly.
1. Overly complex dashboards
Some organizations create analytics dashboards that look impressive but provide little actionable insight. Charts aren’t the goal. Operational improvement is.
2. Ignoring qualitative insights
Technician experience often reveals issues that data alone might miss, showing specific problems or inefficiencies in operations that targeted actions can fix, like slow service response times or equipment failures that aren’t obvious in the numbers. Combining quantitative analytics with field insights leads to better outcomes, such as improved decision-making and enhanced efficiency in service delivery.
3. Treating analytics as a reporting tool
Service analytics should guide operational changes. If insights never lead to process improvements, the analytics initiative eventually loses credibility, which can result in decreased stakeholder trust and reduced investment in future analytics efforts.
4. Underestimating data preparation
Clean, structured service data matters more than sophisticated algorithms. In practice, much of the work lies in organizing historical service records.
Why Pattern Learning Is Becoming Essential
anufacturing service operations are becoming more complex. Equipment is smarter. Customer expectations are higher. Service contracts are increasingly performance-based.
Organizations that rely purely on reactive service models will struggle. Pattern learning, powered by service analytics, provides a way to turn operational data into improvement loops.
The goal isn’t simply faster service resolution. It’s fewer service events in the first place. And that distinction—subtle but important—is what separates mature service organizations from those constantly fighting operational fires. In many ways, service analytics manufacturing strategies are doing for service operations what predictive maintenance did for production lines years ago by enabling organisations to anticipate service needs, optimise resource allocation, and improve overall efficiency.